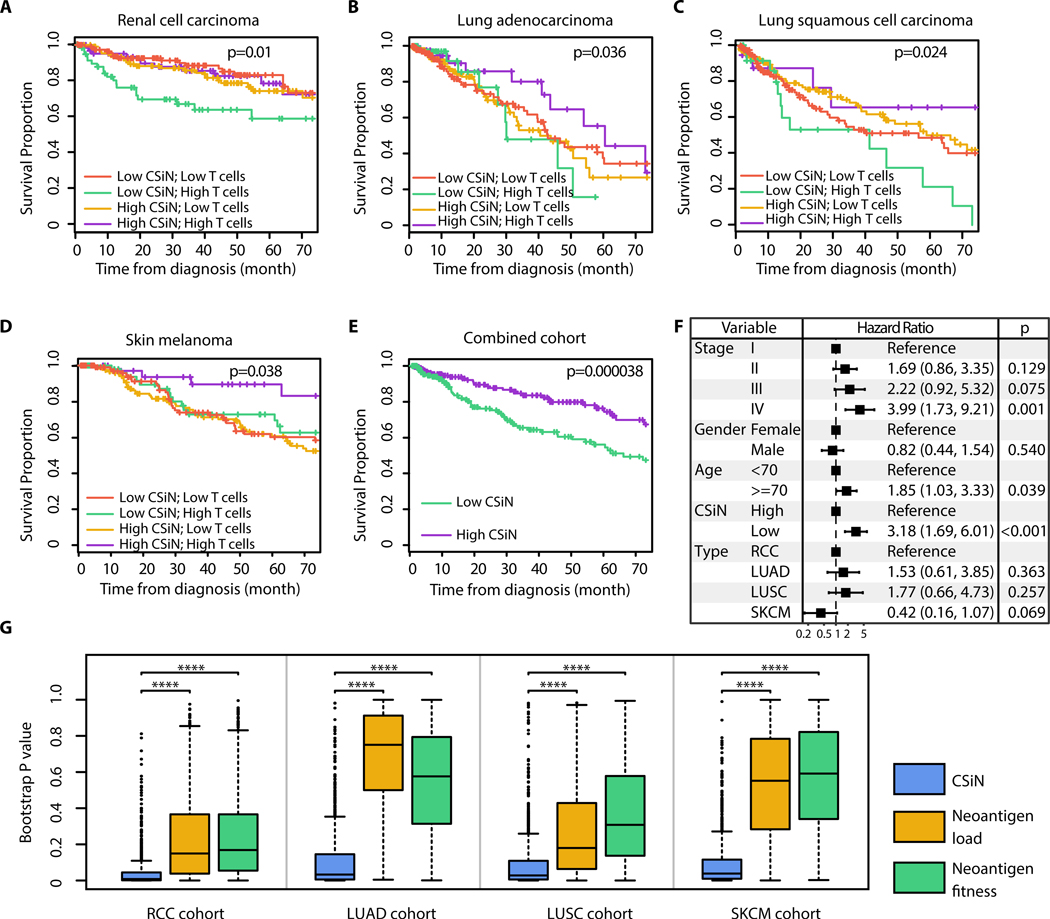
Fig. 3.
Association of CSiN score with overall survival of patients. (A-E) Kaplan-Meier estimator was used to visualize patient overall survival. P values for logrank tests are shown. (A) The RCC cohort. (B) The LUAD cohort. (C) The LUSC cohort. (D) The SKCM cohort. (E) The patients identified as having “High T cells” are extracted from each cohort, combined, and tested together. The high and low CSiN score designations follow those in (A-D). The top 140 RCC patients, 100 LUAD patients, 100 SKCM patients, and 40 LUSC patients with the highest T cell infiltration were designated as having “High T cells”, so the more immunogenic tumor types have more patients selected (83). (F) Forest plot for the coefficients of the multivariate CoxPH analysis of the combined cohort in (D). Disease type, pathological stage, gender, age and the binarized CSiN were included as covariates. The dotted line shows the no effect point. 95% Confidence intervals were shown as bars. (G) Boxplots of bootstrap P values evaluating the robustness of the prognostic performance of CSiN, neoantigen load and the neoantigen fitness score, with each P value generated from a bootstrap resample of each cohort. Two-sided Wilcoxon signed-rank test was used to compare the bootstrap P values. *: P=0.01–0.05, **: P=0.001–0.01, ***: P=0.0001–0.001, ****:P<0.0001.

