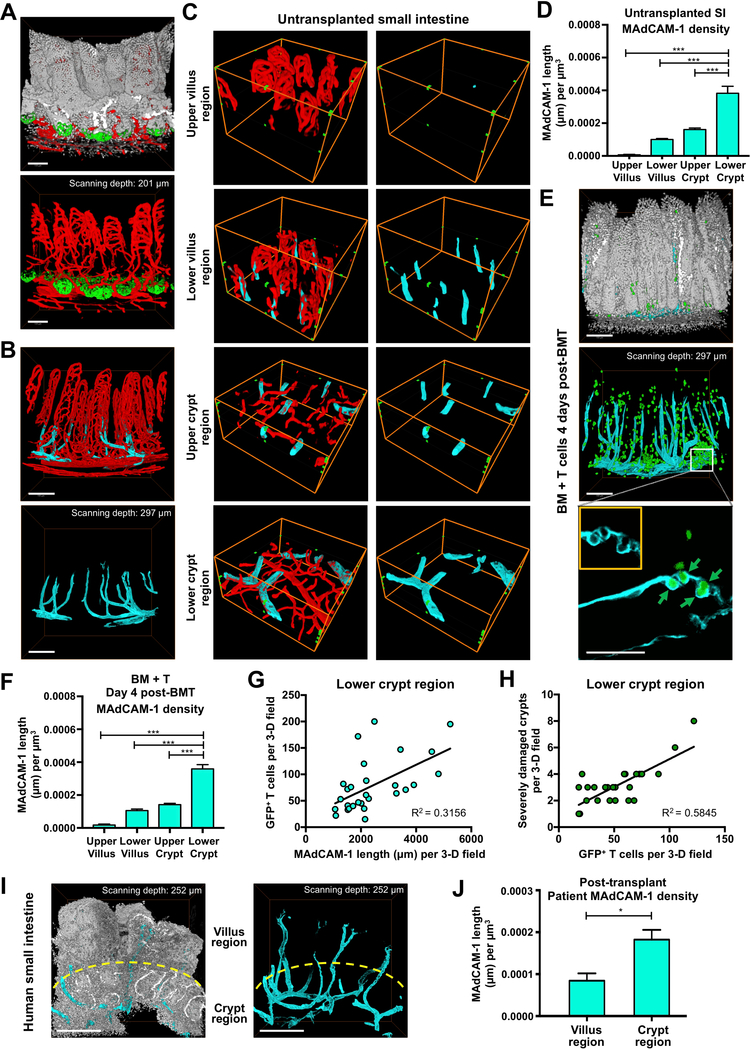
Figure 6. MAdCAM-1+ vessels primarily localize to the crypt regions of the intestinal mucosa.
(A-D) Vessel painting and 3-D immunofluorescent imaging of ileum in normal (untransplanted) mice. (A) 3-D imaging of small intestine vasculature (red) after vessel painting in Olfm4-GFP mice shows greater vascular density in the villus region compared to the crypt region; white, nuclei (DAPI); green, ISCs (anti-GFP); scale bars, 100 μm. (B) 3-D immunofluorescent imaging of MAdCAM-1 staining in light blue (cyan), with MAdCAM-1−vasculature shown in red, reveals that MAdCAM-1+ vessels are predominantly located around the crypt compartment; scale bars, 150 μm. (C) Representative 3-D imaging of MAdCAM-1−vasculature (red) and MAdCAM-1+ vasculature (light blue) in different regions within ileum of BALB/c mice. Green dots outline the scanned volume dimensions: 303.34 × 303.34 × 105 μm 3 (both in upper and lower villus regions); 303.34 × 303.34 × 42 μm 3 (both in upper and lower crypt regions). (D) Quantification of MAdCAM-1 density in different regions as shown in (C); n = 18 (upper and lower villus regions) and n = 23 (upper and lower crypt regions) independent views per region combined from 3–7 independent 3-D views per mouse and five mice per group from two independent experiments. (E-H) Analyses of ileum four days after B6-into-BALB/c BMT with 1 × 10 6 GFP+ donor T cells. (E) 3-D imaging of MAdCAM-1+ vessels (light blue) and donor T cells (green) in recipient SI post-transplant. Upper and middle panels: upper panel provides architectural orientation from DAPI nuclear staining (white); in the middle panel, GFP+ donor T cells appear to localize near MAdCAM-1+ vessels; scale bars, 150 μm. Lower panel: close-up 2-D image of a MAdCAM-1+ vessel in the crypt base region from the 3-D projection image shown in middle panel. Green arrows indicate transendothelial migration of 4 GFP+ donor T cells. A MAdCAM-1+ vessel encircles the donor T cells (inset) while they are migrating out of the vessel to parenchymal areas; scale bar, 50 μm. (F) Quantification of MAdCAM-1 density in different regions four days after BMT as shown in (E); n = 11 (upper and lower villus regions) and n = 28 (upper and lower crypt regions) independent views per region combined from 2–6 independent 3-D views per mouse and 3–5 mice per group from two independent experiments. (G) Comparison of GFP+ donor T cells and MAdCAM-1 density in the lower crypt region; n = 28 independent 3-D views combined from two independent experiments. (H) Comparison of severely damaged crypts (<5 CBCs per crypt) and GFP+ donor T cells in the lower crypt region; n = 29 independent 3-D views combined from two independent experiments. (I) 3-D imaging of MAdCAM-1+ vessels in human duodenal biopsy specimen after clinical allogeneic hematopoietic transplantation; light blue, anti-MAdCAM-1; white, nuclei (DAPI); scale bar, 250 μm. (J) Quantification of patient duodenal MAdCAM-1 density in the villus and crypt regions after transplantation as shown in (I); n = 3 independent 3-D views. Bar graphs represent mean and SEM; lower crypt region vs. other regions; *p < 0.05; ***p < 0.001.

