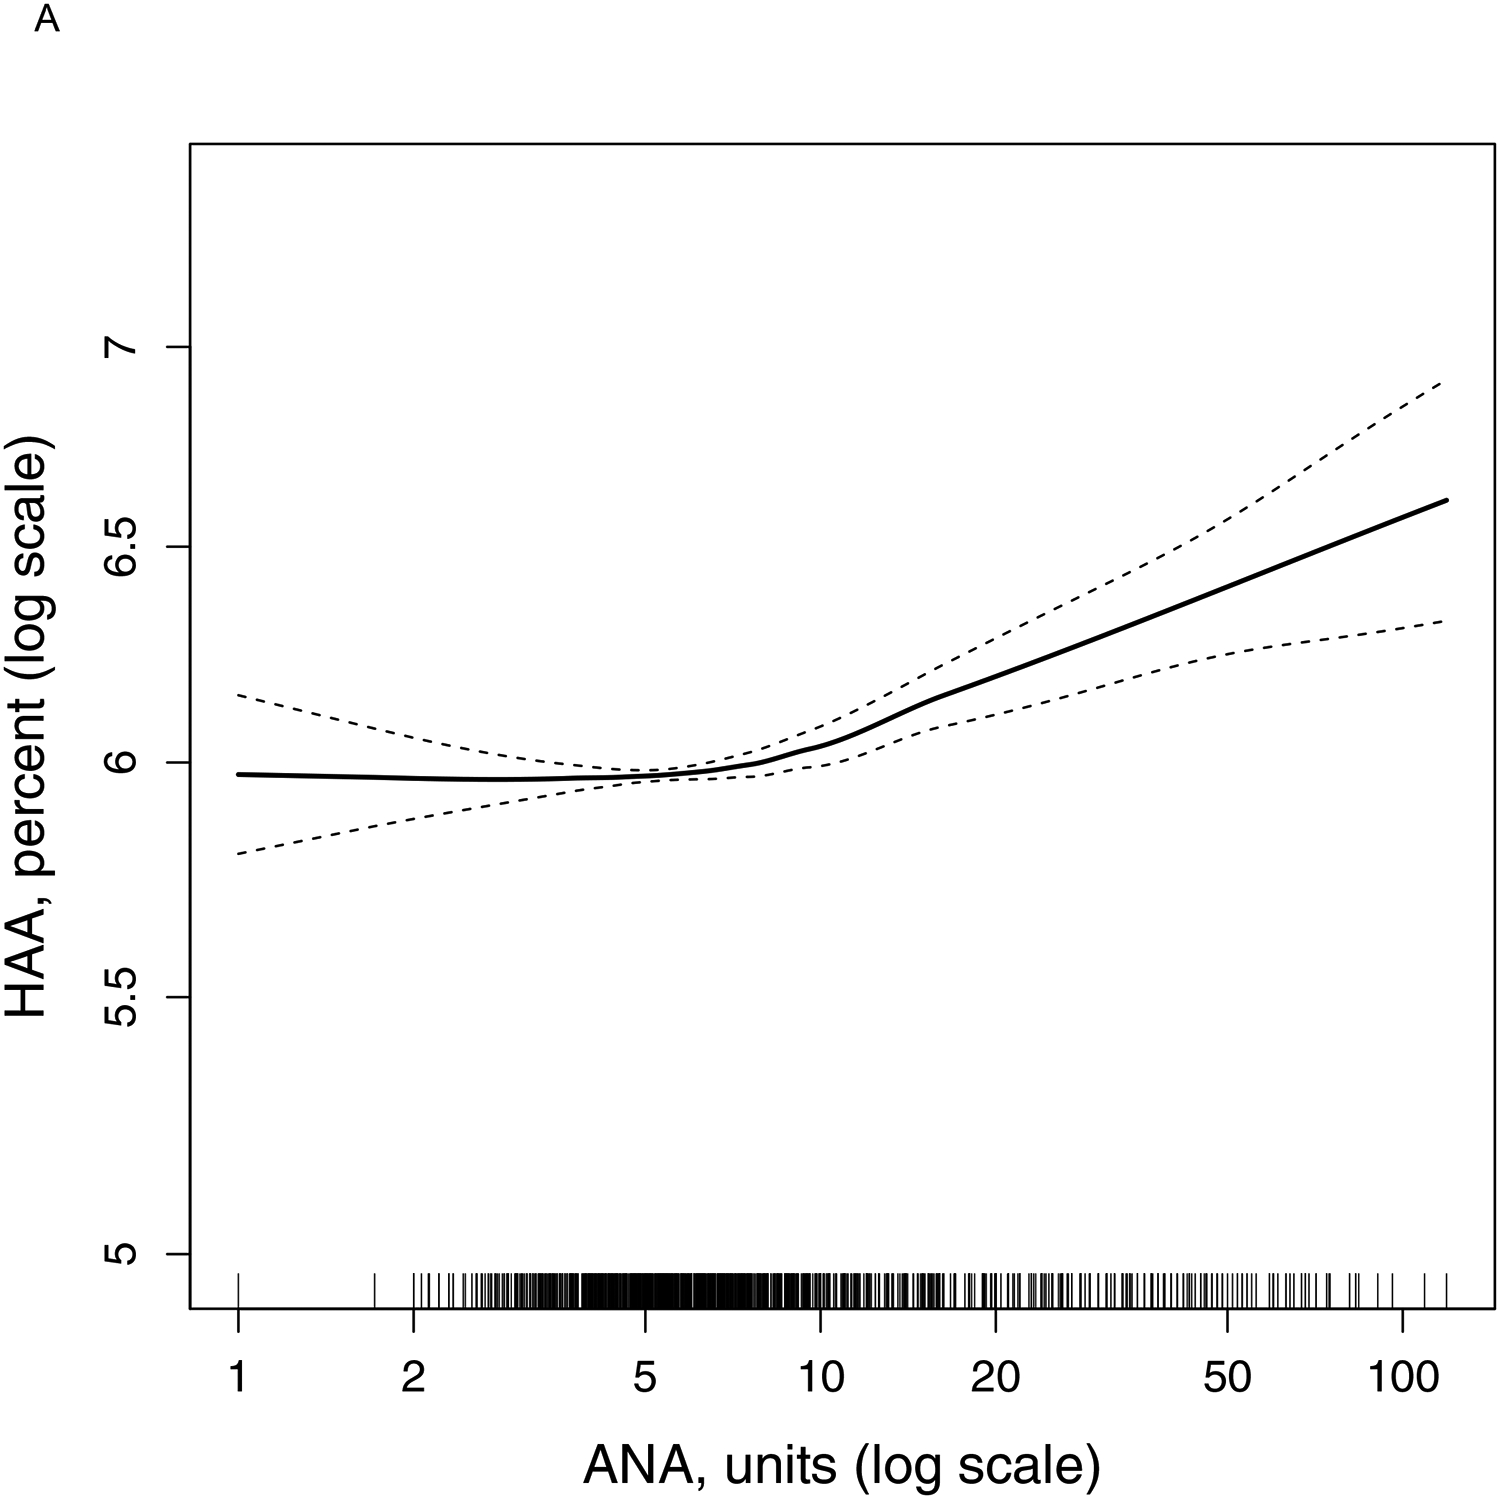
Panel A:

Continuous relationship of antinuclear antibody at Exam 1 with predicted (adjusted) percent high attenuation areas at Exam 1 (N = 6,626). Smoothed regression line (solid black line) is adjusted for age, sex, race/ethnicity, body mass index, height, waist circumference, pack-years of smoking, current smoking status, estimated glomerular filtration rate, study site, education, total imaged lung volume, percent emphysema, and tube current. Thin dashed lines are the 95% confidence bands. Each vertical tick mark on the rug plot along the internal border of the x-axis represents one study participant. Overall p-value for association < 0.001, p-value for non-linearity = 0.002.
