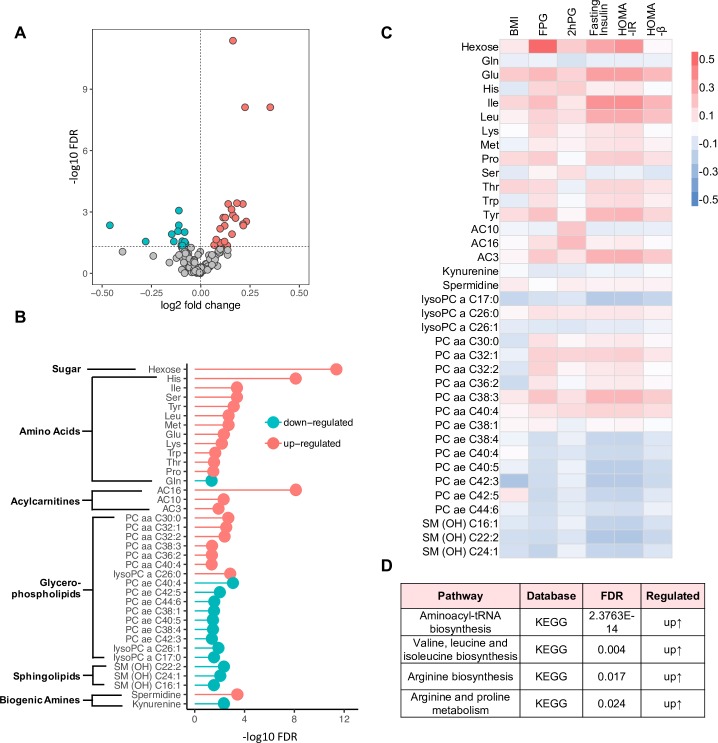
Fig 3. Metabolites and pathways associated with future type 2 diabetes (T2D) at baseline.
(A) Volcano plot shows -log10 FDR against log2-fold change of 141 metabolites in incident T2D group versus non-T2D controls. Green denotes down-regulated metabolites, red denotes up-regulated metabolites, and grey denotes no change. (B) 37 differentially regulated metabolites were associated with incidence of future T2D. Red indicates up-regulation, and green indicates down-regulation. Significance is shown as -log10 FDR. (C) Correlation analysis of the 37 differential metabolites with clinical parameters at baseline using Pearson method. Red boxes indicate positive correlation coefficient (r), and blue boxes, negative. (D) Biological pathways associated with future diabetes onset. 2hPG, 2-hour plasma glucose; FDR, false discovery rate; FPG, fasting plasma glucose; HOMA-B, homeostatic model assessment for beta cell function; HOMA-IR, homeostatic model assessment for insulin resistance; KEGG, Kyoto Encyclopedia of Genes and Genomes.

