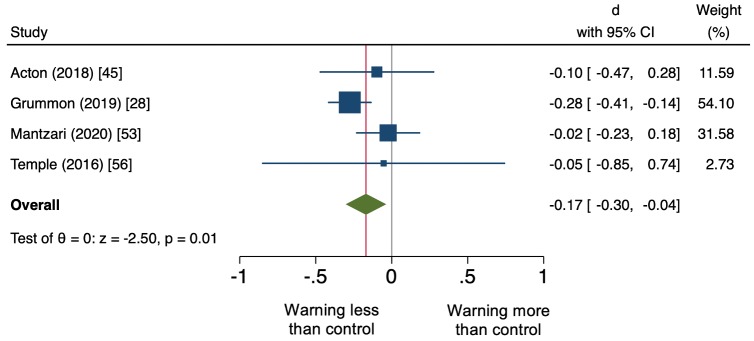
Fig 4. Forest plot displaying effect sizes and 95% CIs for real-stakes selection or purchases of sugary drinks (primary outcome).
The plot shows effect sizes (Cohen’s d with Hedges’s correction; represented by the midpoint of each box) and 95% confidence intervals (represented by the width of each box) for each meta-analyzed study. The weight given to each study in the meta-analysis is listed in the final column and is represented by the area of the box. The overall (meta-analytic) effect size and its confidence interval are represented by the midpoint and width of the diamond, respectively.

