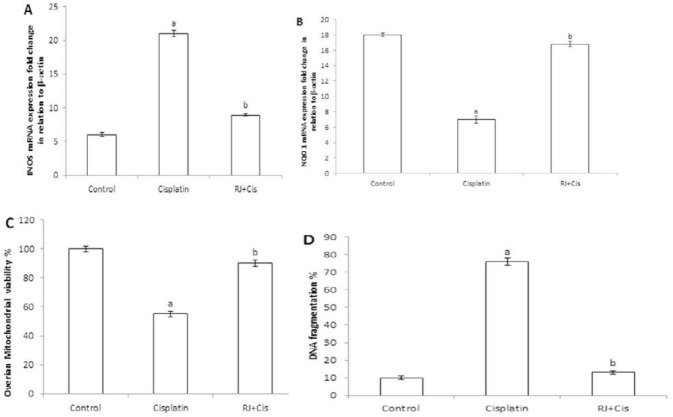
Figure 3.
Estimation of ovarian iNOS, NQO1, mitochondrial viability % and DNA fragmentation %
A) Bar graph shows real time expression analysis of iNOS tran¬script in the ovarian tissues of rats of different experimental groups. B) Bar graph shows real time expression analysis of NQO1 transcript in the ovarian tissues of rats of different experimental groups. C) Bar graph is the representation of ovarian mitochondrial viability % in different experimental groups. D) Bar graph represents DNA fragmentation % in different experimental groups. Data of real-time PCR were used to calculate the relative expression of iNOS and NQO1 genes using the comparative threshold cycle method, and all values were normalized to the β-actin. The data represent means±SD (n=10/group). Cisplatin administration significantly increased ovarian iNOS (P<0.001), and DNA fragmentation % (P<0.001) and reduced NQO1 (P<0.001), and mitochondrial viability (P<0.001) compared to control group. RJ significantly decreased iNOS (P<0.001), and DNA fragmentation % (P<0.001) and increased NQO1 (P<0.001), and mitochondrial viability (P<0.001) compared to cisplatin group. a: indicates a significant difference when compared to the control group at P<0.05, b: indicates a significant difference when compared to cisplatin group at P<0.05. (RJ): Royal jelly, (iNOS): Inducible nitric oxide synthase, (NQO1): Quinone oxidoreductase 1

