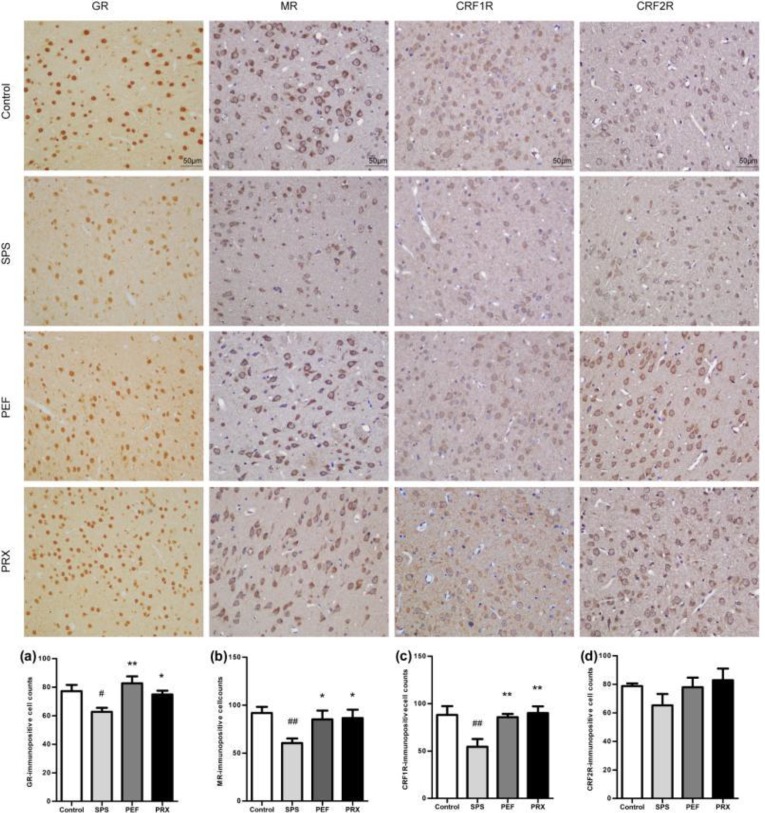
Figure 10.
Expression of GR, MR, CRF1R, and CRF2R in the amygdala of each group (magnification 400×) and results of analysis. Representative immunohistochemistry photomicrographs were shown on the top of this figure. The immunopositive cells' quantitative analysis of GR, MR, CRF1R, and CRF2R were shown in a-b. Values were expressed as mean±SEM (#P<0.05, ##P<0.01 vs control group, *P<0.05, **P<0.01 vs SPS group, n=6)
GR: glucocorticoid receptor; MR: mineralocorticoid receptor; CRF1R: corticotropin releasing factor 1 recaptor; CRF2R: corticotropin releasing factor 2 recaptor; SPS: single prolonged stress; PEF: paeoniflorin; PRX: paroxetine

