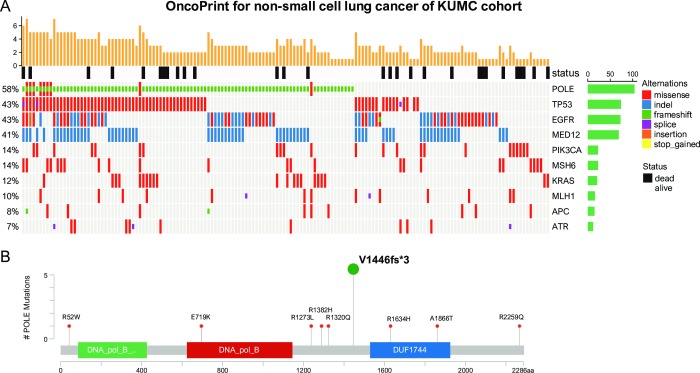
Fig 2. Schematic overview of the overall mutation profiles of 168 non-small cell lung cancers, followed by targeted NGS and analysis.
(A) Each column represents an individual case. The top panel shows patient survival. The bottom panel shows the distribution of mutations. The 6 mutation types are distinguished by color. The right panel represents the overall frequency and the cancer hotspot mutation frequency. (B) Locations of POLE mutations.

