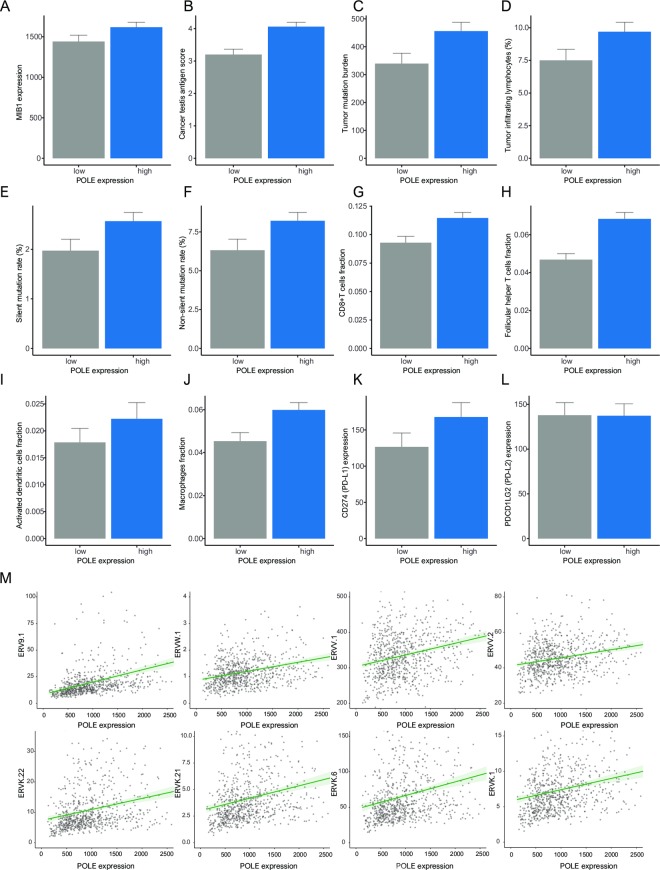
Fig 5.
Bar plots of POLE and the following parameters: (A) MIB-1 (Ki-67), (B) Cancer testis antigen, (C) Tumor mutation burden, (D) Tumor-infiltrating lymphocytes, (E) Silent mutation rate, (F) Non-silent mutation rate, (G) CD8+T cells, (H) Follicular helper T cells, (I) Activated dendritic cells, (J) Macrophage, (K) CD274 (PD-L1), (L) PDCD1LG2 (PD-L2). (M) Pearson’s correlations showing positive correlation between POLE and endogenous retrovirus (ERV): ERV9-1, ERVW-1, ERVV-1, ERVV-2 (top); ERVK-22, ERVK-21, ERVK-6, ERVK-1 (bottom).

