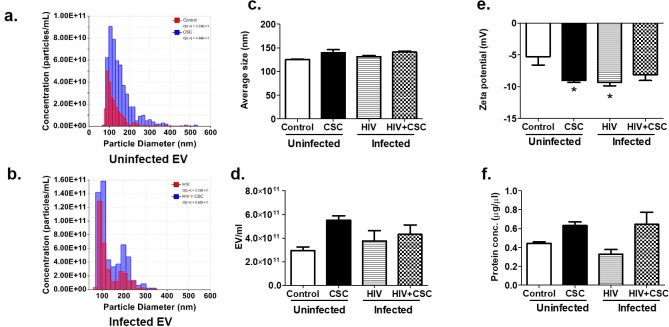
Fig 1. Physical characteristics of Extracellular Vesicles (EV) collected from U937 (uninfected) and U1 (HIV-infected) macrophages treated with CSC.
a. Representative diagram of number of EV/ml for uninfected EV. b. Representative diagram of number of EVs/ml for infected EV. c. Average size of EV. d. Number of EV/ml. e. Zeta potential of EV. Bars represent data from n = 3 replicates. *p<0.05 compared to control. f. Total protein concentration of EV. Bars represent data from n = 3 replicates (except the HIV group, which is n = 2).

