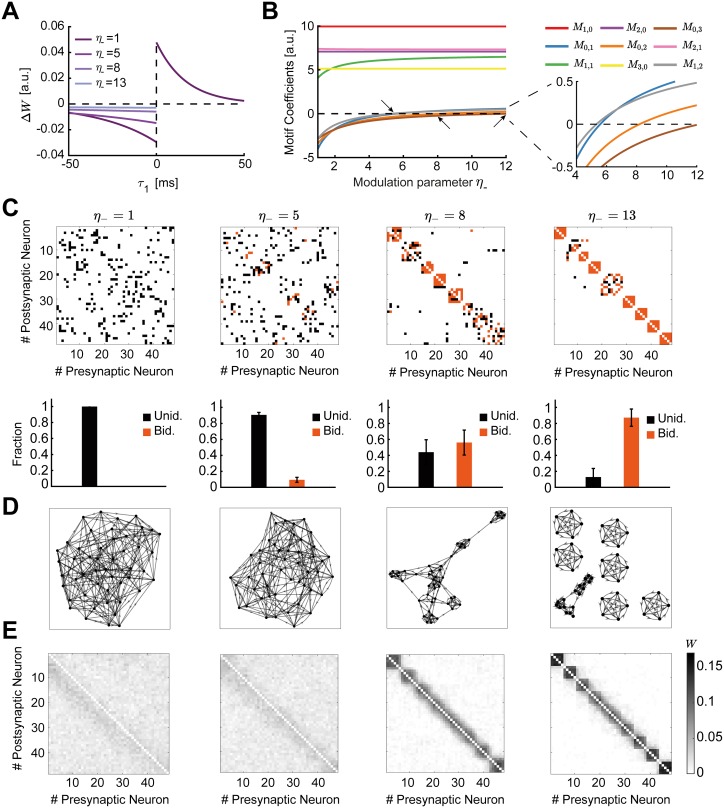
Fig 6. Spontaneous emergence of assemblies via modulation of the triplet STDP rule.
A. The shape of the STDP function changes as a function of the modulation parameter η−, which preserves the overall level of depression by trading off the depression learning rate and the depression time constant. B. Motif coefficients as the modulation parameter η− increases. Points of interest given by the crossovers of the strength of particular motifs are indicated by a small arrow. Inset: Amplified scale around zero. Motif coefficients including γ paths are not illustrated, since they are always constant and positive in η− and do not provide a meaningful comparison to the other motifs. C. Top: Examples of connectivity matrices obtained with different values of η− at steady state. Unidirectional connections are shown in black, bidirectional connections in orange. Matrices are reordered using the k-means clustering algorithm (see Methods). Bottom: Mean fraction of unidirectional and bidirectional connections for 100 trials with different initial synaptic efficacies as a function of η−. Error bars represent the standard error of the mean. D. Graphs of the connectivity matrices in C. E. Averaged connectivity matrices over 100 trials at steady state. Note that the tighter clusters emerging near the edges of the matrices are the result of the clustering algorithm but do not affect the quantification of connectivity.

