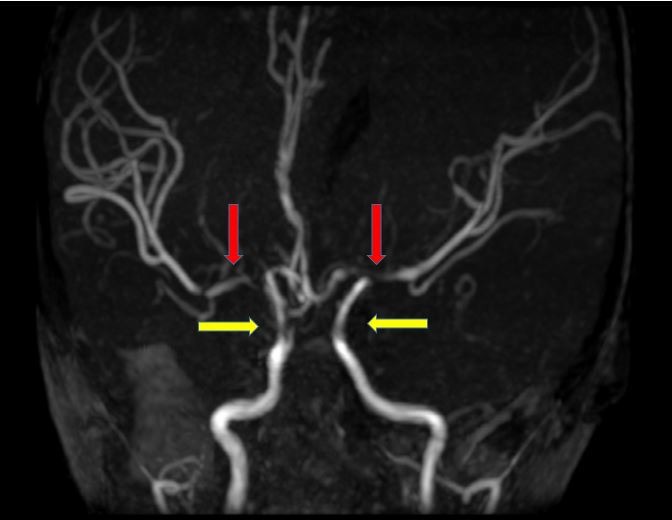
Figure 3.

Magnetic resonance angiogram of the brain showing short segment attenuation of both proximal middle cerebral arteries (left more than right, red arrows) and reduction in calibre of both supraclinoid internal carotid arteries (yellow arrows).
