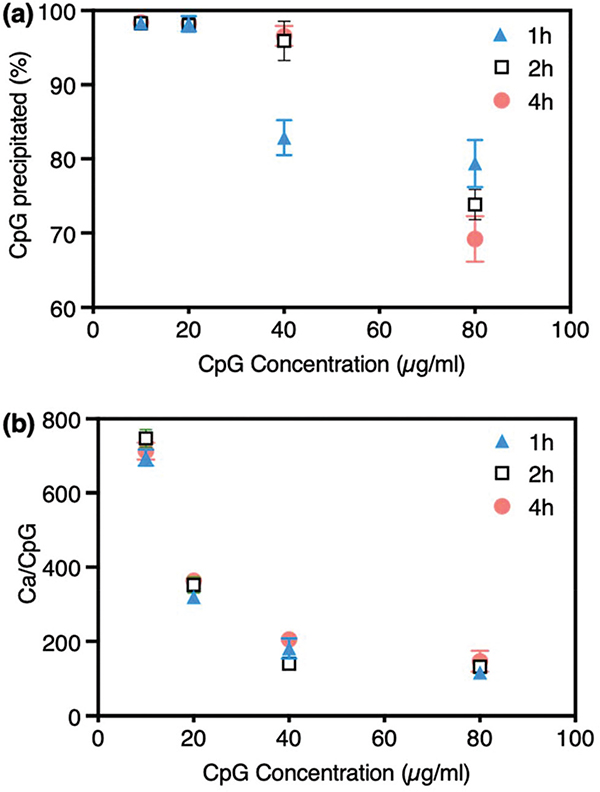
Fig. 2.
Variation of CaP precipitation efficiency by the concentration of CpG 2216 and mineralization time. (a) The percentage of CpG precipitated on CaPs decreased when the CpG concentration was increased. (b) The Ca/CpG ratio also decreased steadily by increasing the CpG concentration to 40 μg mL−1 and did not change significantly when the CpG concentration was doubled (80 μg mL−1). Some error bars are very small and not visible in the graphs.

