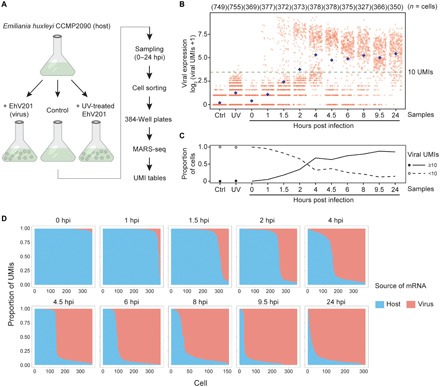
Fig. 1. Transcriptome profiling of EhV infection in E. huxleyi at single-cell resolution.

(A) The experimental setup for using scRNA-seq to study EhV infection of E. huxleyi. Individual cells were isolated using FACS during a time course of 0 to 24 hours post infection (hpi). The single-cell transcriptomes were sequenced using the MARS-seq protocol, which allows absolute quantification of viral and host transcripts by tagging each individual cell and each transcript with cellular barcodes and UMIs, respectively. (B) Highly heterogeneous total viral UMI counts among single cells across samples. Each red dot represents an individual cell, and each blue diamond represents the mean of all cells in each column. A threshold of 10 UMIs (fig. S3) highlights the bimodality of the overall viral expression and excludes cells with low- or noise-level viral UMIs, as in mock infection by UV-deactivated EhV (UV; 4 and 6 hpi) and control (Ctrl) samples. (C) The proportion of cells with at least 10 viral UMIs (active viral expression) increased rapidly during early hours of infection and approached 90% at 9.5 hpi. (D) Cliff diagrams represent the relative mRNA levels of host and virus across the infection time course. The cells (columns) are sorted by the relative proportions of host and viral mRNA, showing the sharp decrease in host mRNA relative to viral mRNA (“cliff”) and the within-population heterogeneity through time.
