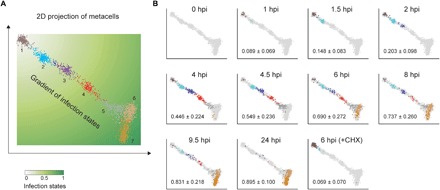
Fig. 2. The continuum of infection states across individual cells.

(A) A 2D projection of 2072 single infected cells (dots) with active viral expression (≥10 viral UMIs) that constitute seven metacells (in different colors). The cells form a continuum of infection states that can be quantified by the relative distance to the initial infection state. (B) Distribution of cells from each sampling time point along the infection continuum, with light gray dots representing cells from the other time points. Numbers are means ± SD of the infection states as defined in (A). CHX, cycloheximide treatment before infection. The infection index, a proxy for infection states, (A) of an individual cell was calculated as the ratio of the distance of this cell from the upper-left origin to the distance between the origin and the lower-right end. A color gradient was painted on the basis of the scale of the infection indices between 0 and 1.
