. 2020 Apr 27;9:e54568. doi: 10.7554/eLife.54568

Figure 6. Sim promotes follicle cell differentiation into the final maturation stage.

(A–F) The expression of Hnt (A), Cut (B), Ttk69 (C), EcR.A (D), EcR.B1 (E), and Br-C (F) in stage-14 egg chambers with flip-out Gal4 clones overexpressing simRNAi (marked by green GFP). Insets show higher magnification of Hnt (A), Cut (B), Ttk69 (C), EcR.A (D), EcR.B1 (E), and Br-C (F) expression in squared areas with the clone boundary marked by red dashed line. (G–H) Hnt expression (red in G-H) in stage-10B (G) and stage-12 (H) egg chambers with flip-out Gal4 clones overexpressing simRNAi. Insets show higher magnification of Hnt expression in squared areas with the clone boundary marked by red dashed line. (I–J) Cut expression (red in I-J) in stage-10B (I) and stage-12 (J) egg chambers with flip-out Gal4 clones overexpressing simRNAi. Insets show higher magnification of Cut expression. (K) Ftz-f1 expression (red in K) in stage-10B egg chambers with flip-out Gal4 clones overexpressing simRNAi. Insets show higher magnification of Ftz-f1 expression in squared areas with the clone boundary marked by red dashed line. Nuclei are marked by DAPI in blue.
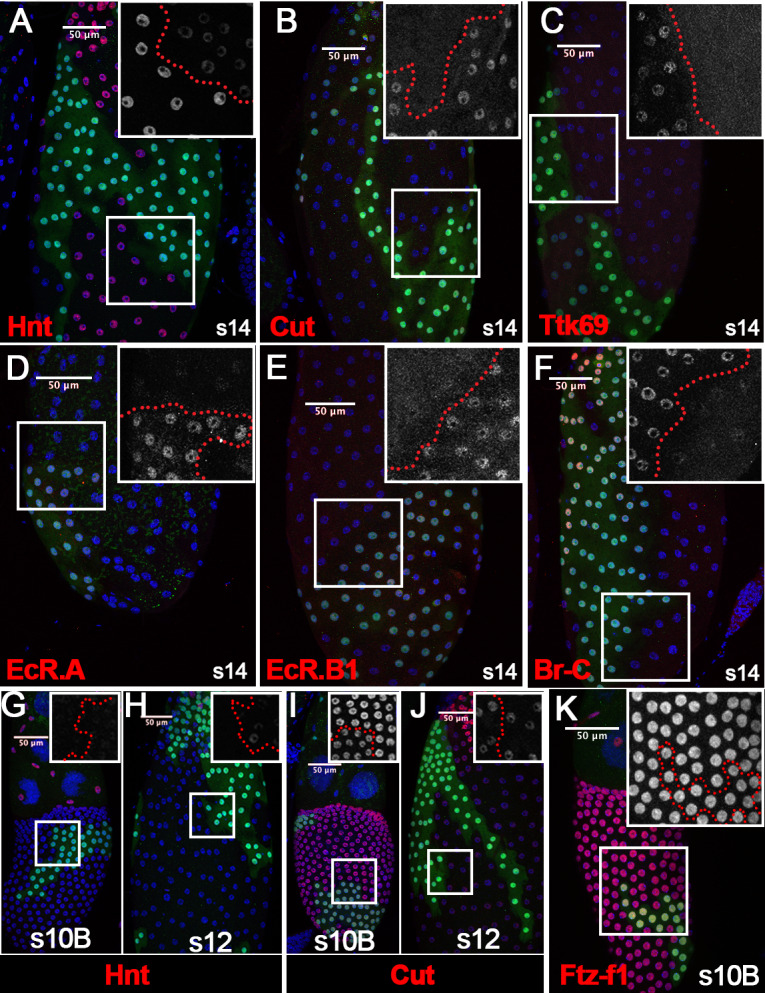
Figure 6.

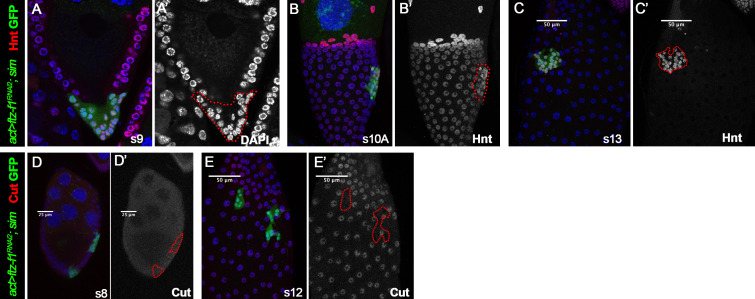
Figure 6—figure supplement 1. Overexpression of sim disrupts earlier follicle cell differentiation.

Figure 6—figure supplement 1.

Flip-out Gal4 clones with sim overexpression and ftz-f1 knockdown are marked by green GFP and outlined. (A–B) Hnt (red in A-B, and white in B’) is detected in clone cells in stage-9 (A) and stage-10A (B) egg chambers. Clone cells exhibit smaller nuclei and abnormal cell organization. (C) Hnt (red in C and white in C’) is continuously expressed in clone cells at stage 13. (D–E) Cut (red in D,E and white in D’,E’) is properly downregulated in flip-out Gal4 clones at stage 8 (D) and is not upregulated in clone cells at stage 12 (E). Nuclei are marked by DAPI in blue.
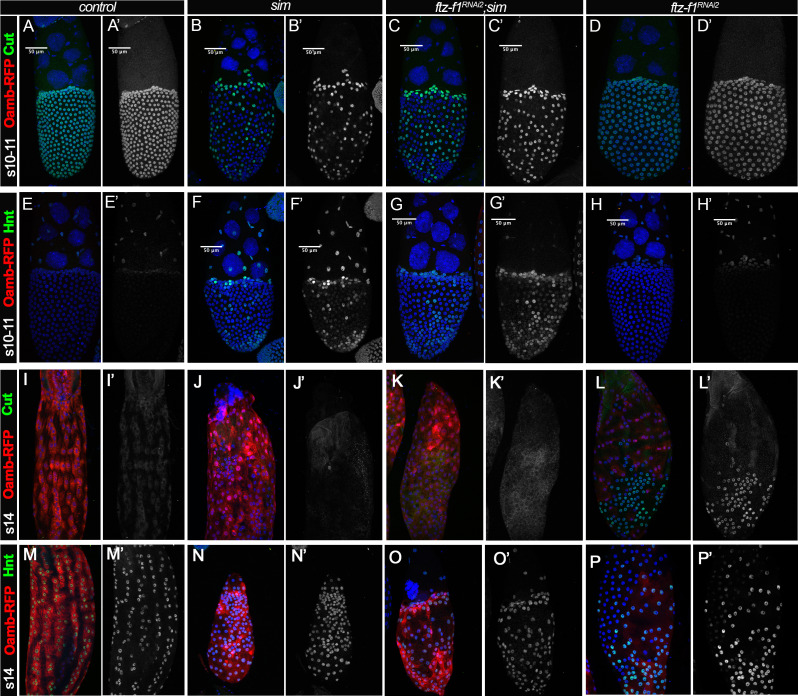
Figure 6—figure supplement 2. Rescue ftz-f1 defect with Vm26Aa-Gal4 driving sim overexpression.

Figure 6—figure supplement 2.

(A–H) Representative images show Cut expression (green in A-D and white in A’-D’) and Hnt expression (green in E-H and white in E’-H’) in stage-10B/11 egg chambers from control (A and E), sim (B and F), sim;ftz-f1RNAi2 (C and G), and ftz-f1RNAi2 (D and H) females with Vm26Aa-Gal4, UAS-dcr2; Oamb-RFP. (I–P) Representative images show Cut (green in I-L and white in I’-L’) and Hnt (green in M-P and white in M’-P’) expression in stage-14 follicles marked by Oamb-RFP expression (shown in red). Nuclei are marked by DAPI in blue.