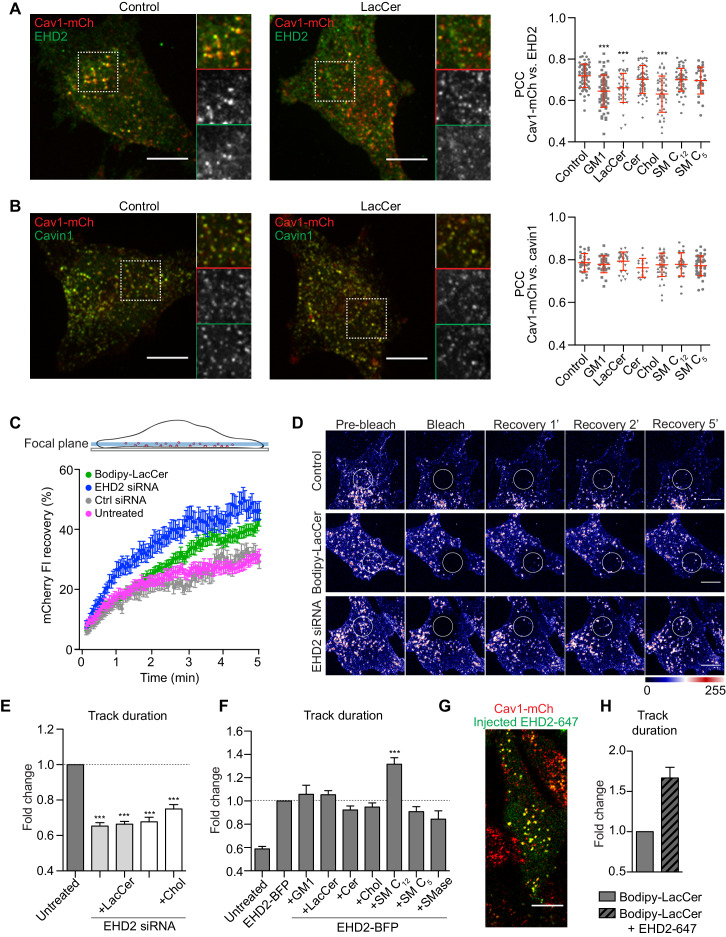
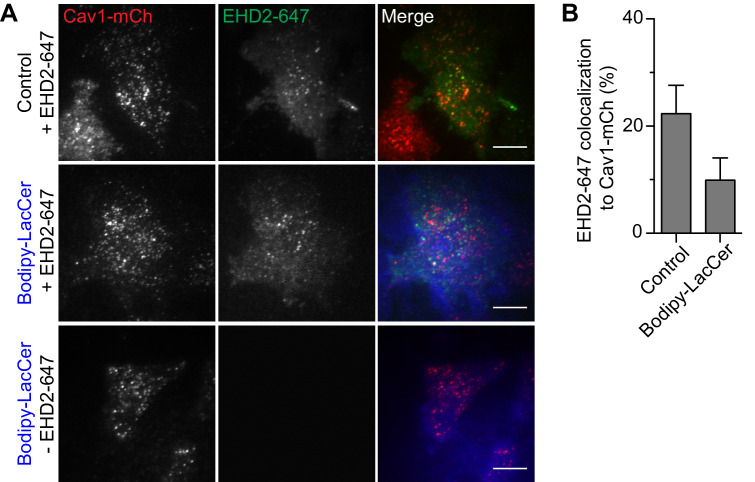
Figure 3. Chol and GSLs induce surface release of caveolae via an EHD2-dependent mechanism.
(A) Representative images of maximum projected confocal z-stacks of Cav1-mCh HeLa cells. Untreated cells or cells treated with LacCer-Bodipy liposomes for 1 h, fixed and immunostained for endogenous EHD2. High-magnification images (dotted square) show localization of EHD2 to Cav1-mCh (see scatterplot for quantification). n ≥ 60, two independent experiments, mean ± SEM. ***, p≤0.001 vs. control. (B) Experimental protocols analogous to (A), with exception of endogenous cavin1 immunostaining. n ≥ 60, mean ± SEM. (C) Confocal FRAP of Cav1-mCh HeLa cells treated with either EHD2 siRNA or Bodipy-LacCer liposomes. A ROI was photobleached and recovery of mCherry FI monitored over 5 min. mCherry FI was normalized to background and reference. n ≥ 10, mean ± SEM. (D) Representative time-lapse series showing control Cav1-mCh HeLa cells and cells treated with either EHD2 siRNA or Bodipy-LacCer liposomes. The photobleached area is outlined with white circles. mCherry FI is intensity‐coded using LUT. (E) Effects of lipids on track duration of Cav1-mCh structures were analyzed following siRNA-mediated depletion of EHD2. n ≥ 8, two independent experiments, mean ± SEM. (F) Quantification of track duration of untreated Cav1-mCh HeLa cells or cells transiently expressing EHD2-BFP with or without incubation with liposomes. Changes in track duration are relative to EHD2-BFP control (indicated by dotted line). n ≥ 8, two independent experiments, mean + SEM. ***, p≤0.001 vs. control cells. (G) Representative live cell confocal image of EHD2-647 microinjected into Cav1-mCh HeLa cells. (H) Quantification of track duration of Cav1-mCh cells treated with Bodipy-LacCer and following microinjection of EHD2-647. n = 8, mean + SEM. All scale bars, 10 μm.

