. 2020 May 4;9:e55038. doi: 10.7554/eLife.55038

Figure 4. LacCer, Chol, and SM accumulate in caveolae and Chol is sequestered within these domains.

(A–D) Cav1-mCh HeLa cells transiently expressing EHD2-BFP were incubated with Bodipy-lipids. White lines indicate location of kymograph. TIRF movies were recorded at 3 s intervals for 5 min. Scale bars, 10 μm; kymograph scale bars, 5 μm. See Figure 4—videos 3 and 4. (E) Cav1-mCh HeLa cells transiently expressing EHD2-BFP were incubated with Bodipy-LacCer for 10 min. Following photobleaching (yellow ROI), recovery of Bodipy signal within caveolae (red ROI) and bulk PM (cyan ROI) was monitored over time. White arrows highlight surface connected caveolae with accumulated Bodipy-LacCer. Scale bar, 10 μm. (F) Recovery curves of Bodipy intensities within caveolae ROI (red) and bulk PM ROI (cyan). Bodipy FI was normalized to background and reference.

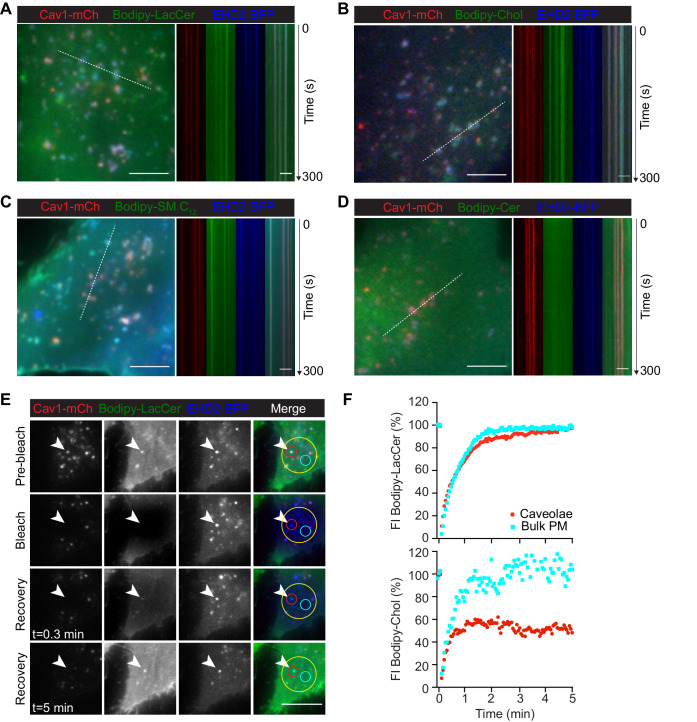
Figure 4—source data 1. Excel file containing source data pertaining to Figure 4F.

Figure 4.

Figure 4—figure supplement 1. Localization of Bodipy-lipids to Cav1-mCh positive for EHD2-BFP.

Figure 4—figure supplement 1.

(A) Cav1-mCh HeLa cells transiently expressing EHD2-BFP were incubated with Bodipy-lipid liposomes. White lines shown in Figure 4A–D indicate the location of the kymograph and the corresponding intensity profiles illustrate the colocalization of Bodipy-lipids with Cav1-mCh in the presence of EHD2-BFP. Intensity profiles are relative to the maximum value for each sample. (B) Quantification of EHD2-positive caveolae colocalizing with Bodipy-lipids. n ≥ 8, at least two independent experiments, mean ± SEM.
Figure 4—figure supplement 1—source data 1. Excel file containing source data pertaining to Figure 4—figure supplement 1A and B.
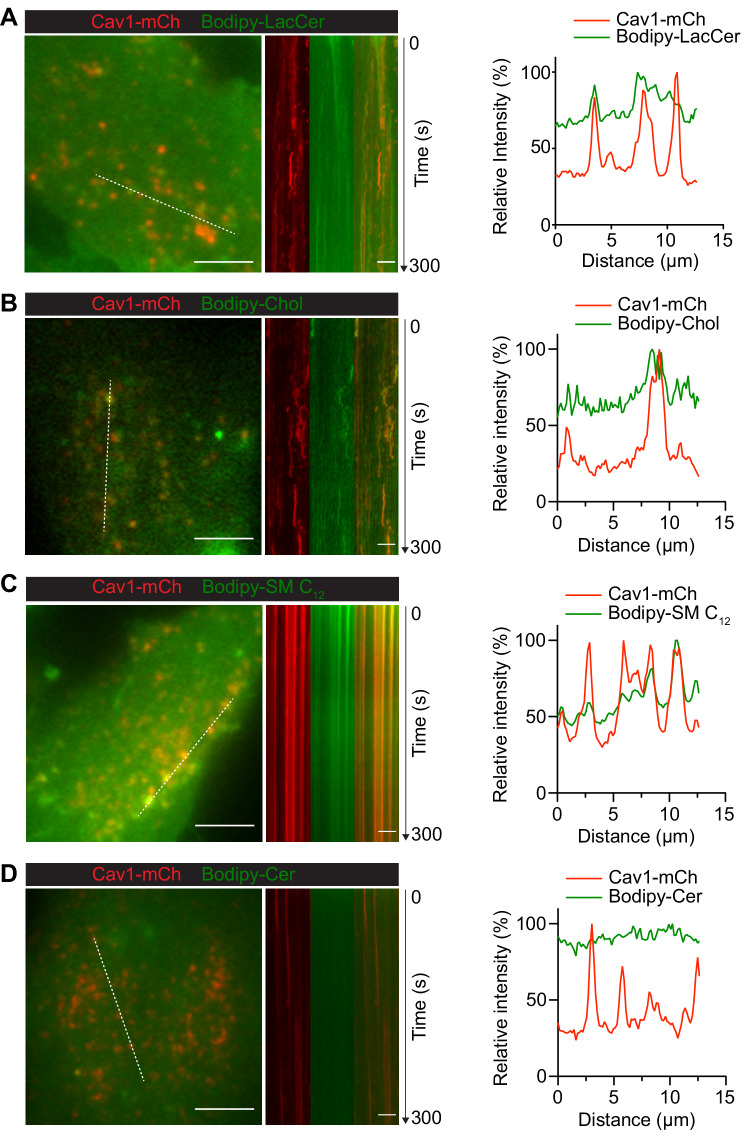
Figure 4—figure supplement 2. Kymographs of Cav1-mCh HeLa cells incubated with Bodipy-lipid liposomes.

Figure 4—figure supplement 2.

(A–D) Cav1-mCh HeLa cells were incubated with Bodipy-lipid liposomes as indicated. White lines indicate the location of the kymograph and the corresponding intensity profiles illustrate the colocalization of Bodipy-lipids with Cav1-mCh. Intensity profiles are relative to the maximum value for each sample. Scale bars, 10 μm; kymograph scale bars, 5 μm.
Figure 4—figure supplement 2—source data 1. Excel file containing source data pertaining to Figure 4—figure supplement 2A–D.
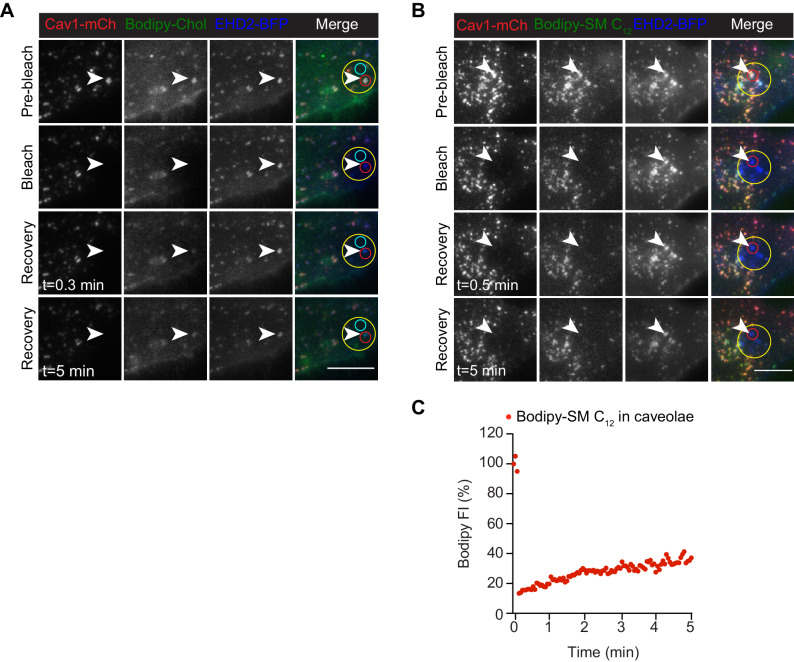
Figure 4—figure supplement 3. Bodipy-Chol and Bodipy-SM C12 are sequestered within caveolae.

Figure 4—figure supplement 3.

(A, B) Bodipy fluorescence recovery experiments to study the accumulation of lipids in caveolae. Cav1-mCh HeLa cells transiently expressing EHD2-BFP were incubated with liposomes containing either (A) Bodipy-Chol or (B) Bodipy-SM C12 for 10 min. Following photobleaching (yellow ROI), the fluorescence recovery of the Bodipy signal within caveolae (red ROI) and the bulk PM (cyan ROI) was monitored over time. White arrow highlights surface connected caveolae with accumulated Bodipy-lipid. Scale bars, 10 μm. (C) Bodipy signal recovery within caveolae. Cav1-mCh HeLa cells transiently expressing EHD2-BFP were incubated with Bodipy-SM C12 liposomes for 10 min. Representative recovery curve of Bodipy intensities within caveolae ROI is shown following photobleaching. Bodipy FI was normalized to background and reference.
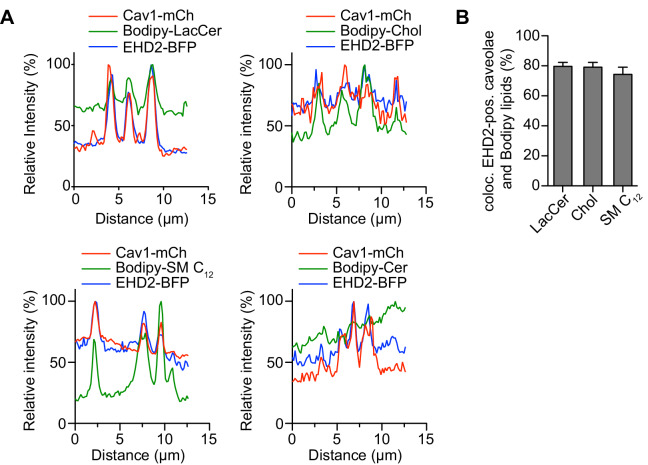
Figure 4—figure supplement 3—source data 1. Excel file containing source data pertaining to Figure 4—figure supplement 3C.
Figure 4—video 1. Bodipy-LacCer colocalizes with Cav1-mCh positive structures.
Download video file (513.2KB, mp4)
A representative TIRF live cell movie of Dox-induced Cav1-mCh HeLa cells after incubation with liposomes containing Bodipy-LacCer. The image in Fig. 4A is taken from this movie and corresponds to the ROI highlighted by the white square. Movie in real time spans 5 min and was recorded at 3 s intervals. Scale bar, 10 μm.
Figure 4—video 2. Bodipy-Chol colocalizes with Cav1-mCh positive structures.
Download video file (853.1KB, mp4)
A representative TIRF live cell movie of Dox-induced Cav1-mCh HeLa cells after incubation with liposomes containing Bodipy-Chol. The image in Fig. S4A is taken from this movie and corresponds to the ROI highlighted by the white square. Movie in real time spans 5 min and was recorded at 3 s intervals. Scale bar, 10 μm.
Figure 4—video 3. Bodipy-LacCer accumulates in caveolae.
Download video file (244.4KB, mp4)
A representative TIRF live cell movie of Dox-induced Cav1-mCh HeLa cells transiently expressing EHD2-BFP after incubation with liposomes containing Bodipy-LacCer. The image in Fig. 4B is taken from this movie and corresponds to the ROI highlighted by the white square. Movie in real time spans 5 min and was recorded at 3 s intervals. Scale bar, 10 μm.
Figure 4—video 4. Bodipy-Chol accumulates in caveolae.
Download video file (966KB, mp4)
A representative TIRF live cell movie of Dox-induced Cav1-mCh HeLa cells transiently expressing EHD2-BFP after incubation with liposomes containing Bodipy-Chol. The image in Fig. S4B is taken from this movie and corresponds to the ROI highlighted by the white square. Movie in real time spans 5 min and was recorded at 3 s intervals. Scale bar, 10 μm.