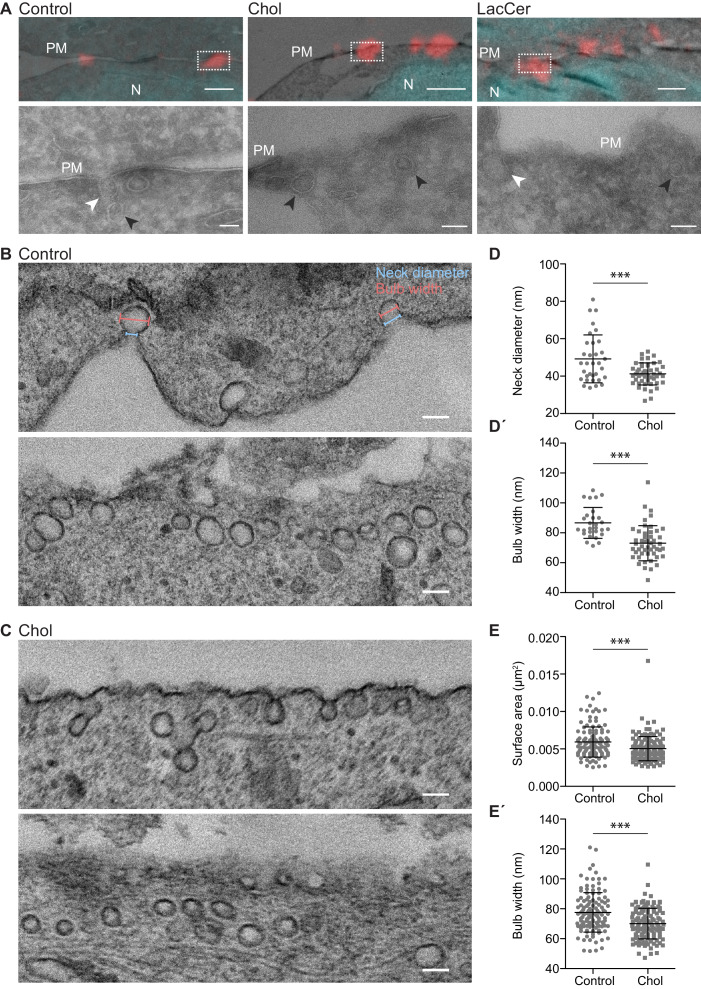
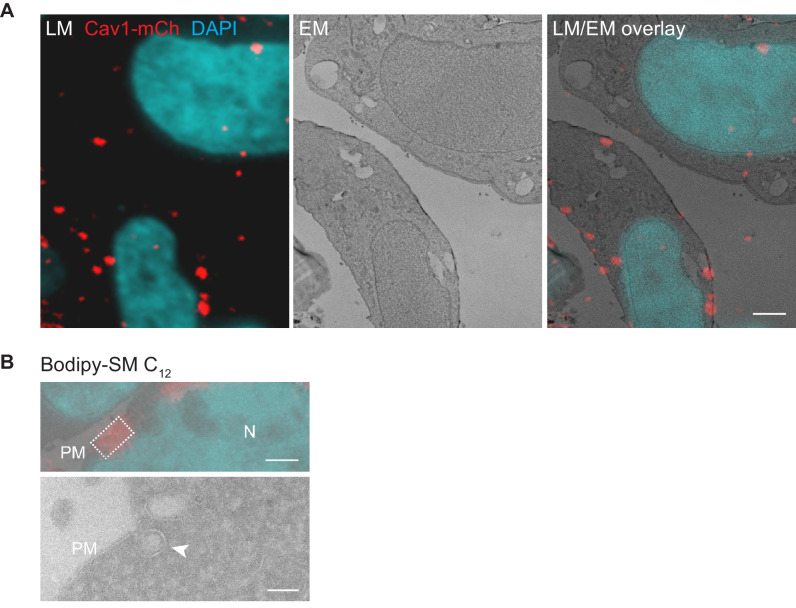
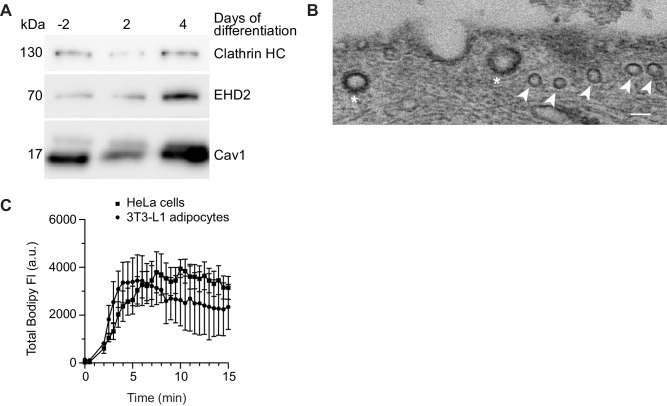
Figure 5. Chol accumulation reduces the caveolae diameter in 3T3 adipocytes.
(A) Representative overlays of light microscopy images with corresponding electron micrographs showing localization of caveolae (Cav1-mCh in red) and nuclei (DAPI in cyan) for untreated Cav1-mCh HeLa cells (control) or cells treated with Bodipy-labeled Chol or LacCer. Dotted boxes show regions of higher magnification in corresponding panels below. N, nucleus; PM, plasma membrane. White arrows denote surface connected caveolae and black arrows indicate surface adjacent caveolae. Scale bars, 1 μm; inset scale bars, 100 nm. (B, C) Electron micrographs of control 3T3-L1 adipocytes (B) and 3T3-L1 adipocytes treated with Bodipy-Chol (C). Top and bottom panels show two representative images per sample: one with clear surface connected necks and one without. Cells were chemically fixed, embedded in resin, and processed for electron microscopy. Scale bars, 100 nm. (D, D’) Scatter plots showing the quantification of neck diameter (D) and bulb width (D’) of surface connected caveolae in 3T3-L1 adipocytes. Bulb width and neck diameter are highlighted in (B), upper panel. n ≥ 30, mean ± SEM. (E, E’) Scatter plots showing the quantification of surface area (E) and bulb width (E’) of surface adjacent caveolae in 3T3-L1 adipocytes. n ≥ 120, mean ± SEM. ***, p≤0.001.


