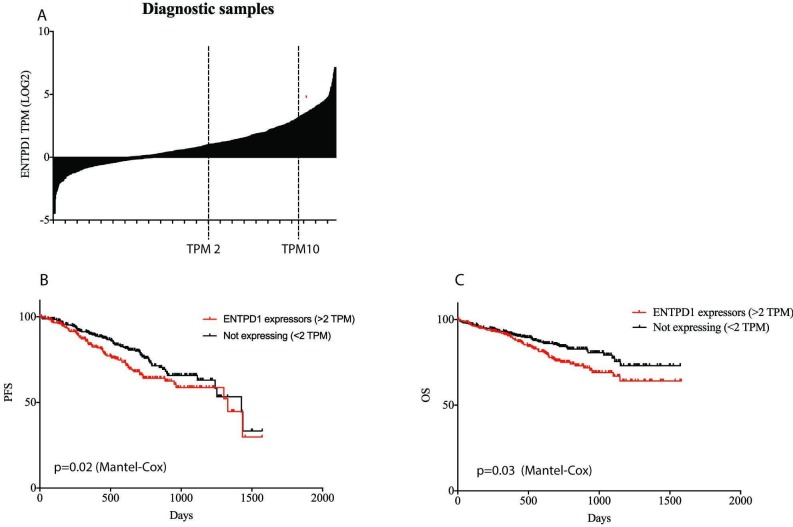
Figure 5.
Expression of CD39 mRNA level and correlation with disease progression of MM patients. Data from the CoMMpass database IA10 release. (A) Expression of ENTPD1 (TPM, log2) in 736 diagnostic MM patient samples. (B) PFS and (C) OS curves generated from the CoMMpass data by comparing the ENTPD1 expressers (TPM >2; n=320) with the low expressers (TPM <2; n=416). MM, multiple myeloma; OS, overall survival; PFS, progression-free survival; TPM, transcript per million.

