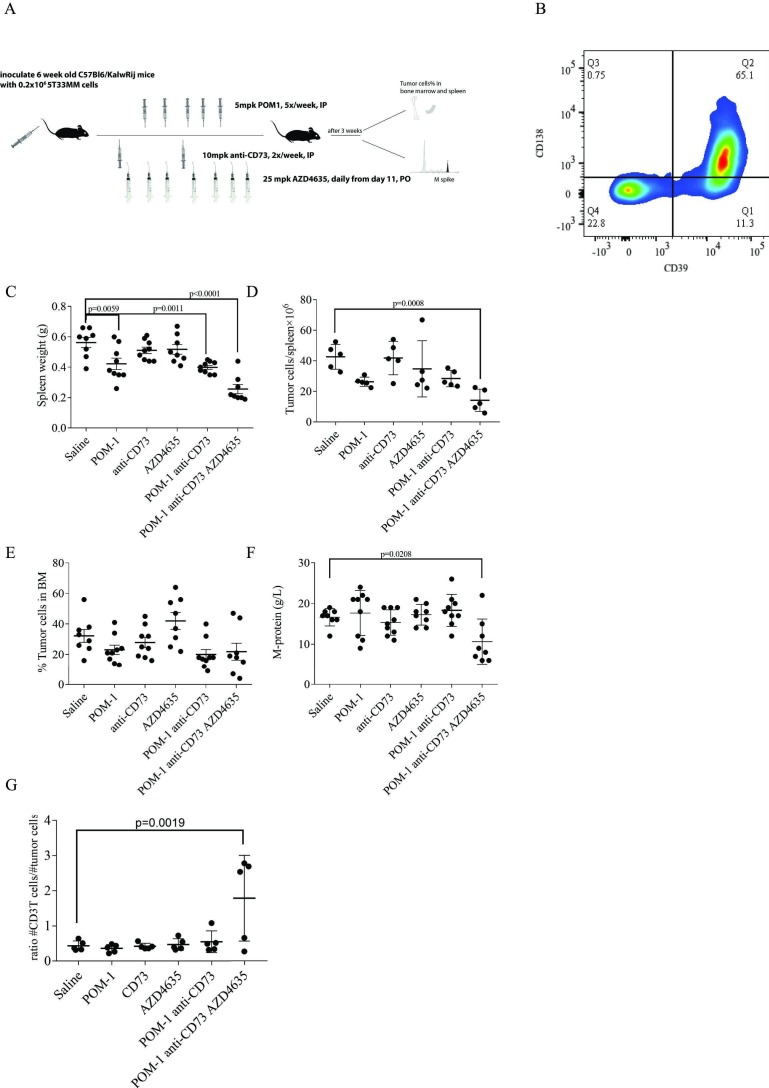
Figure 6.
The effect of inhibiting CD39, CD73, and A2AR in vivo in the 5T33MM model. (A) Schematic picture for the experiment (mpk=mg/kg). (B) FACS analysis of CD39 expression on CD138+ 5T33 MM cells. (C–G) C57Bl6KalwRij mice were treated with either a CD39 inhibitor (POM-1), CD73 antibody, and/or an A2AR inhibitor as described in the Methods section. Spleens were weighed (C) and cells from five of the mice were further analyzed for CD138+ MM cells by FACS analysis, CD138+ cells/spleen were calculated (n=5) (D). BM was collected for analysis of BM plasmacytosis on cytosmears (E) and serum was collected for M-protein analysis by protein electrophoresis (F). Analysis of spleen cells by FACS as described shows the ratio of CD3+ cells per number of CD138+ tumor cells in the spleen (n=5) (G). Results are expressed as mean and SD. Statistical differences were calculated using one-way Analysis of variance (ANOVA). A2AR, adenosinereceptor A2A; BM, bone marrow; MM, multiple myeloma.

