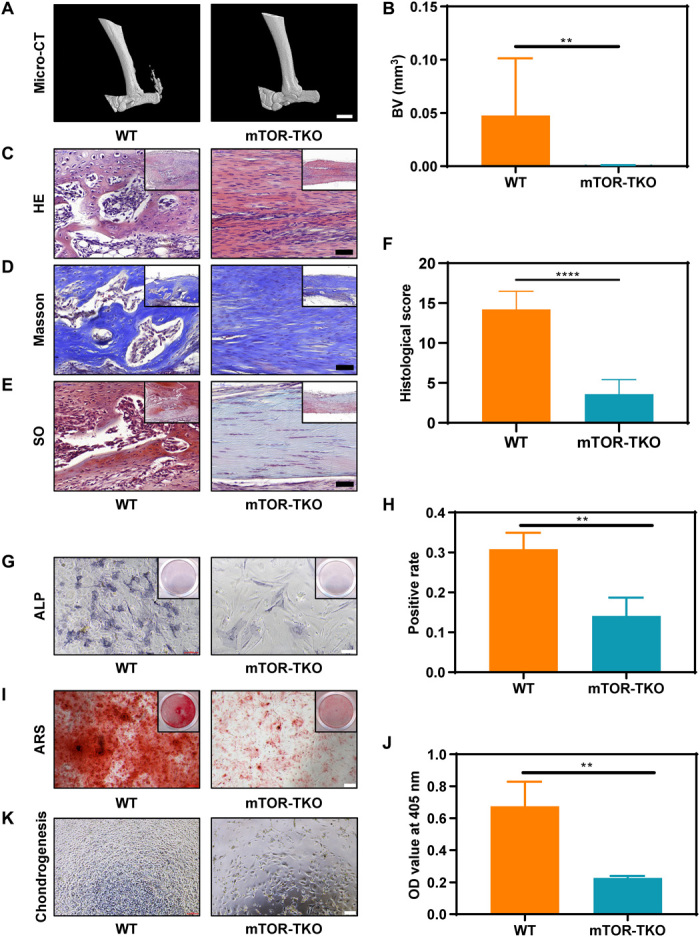
Fig. 1. The mTOR signaling pathway is required in tendon HO.

(A and B) Micro-CT imaging and quantitative analysis of the Achilles tendon from WT and mTOR knockout (mTOR-TKO) mice. n = 10. Scale bar, 2 mm. (C to F) HE, Masson, and SO staining and histological score evaluation of WT and mTOR-TKO mice. n = 10. Scale bar, 50 μm. (G and H) ALP staining and positive rate of cells cultured in an osteogenic medium for 7 days. n = 3. Scale bars, 100 μm. (I and J) ARS staining and optical density (OD) value of cells cultured in the osteogenic medium for 14 days. n = 3. Scale bar, 200 μm. (K) Light microscopy of cells cultured in the chondrogenic medium for 3 days. BV, bone volume.
