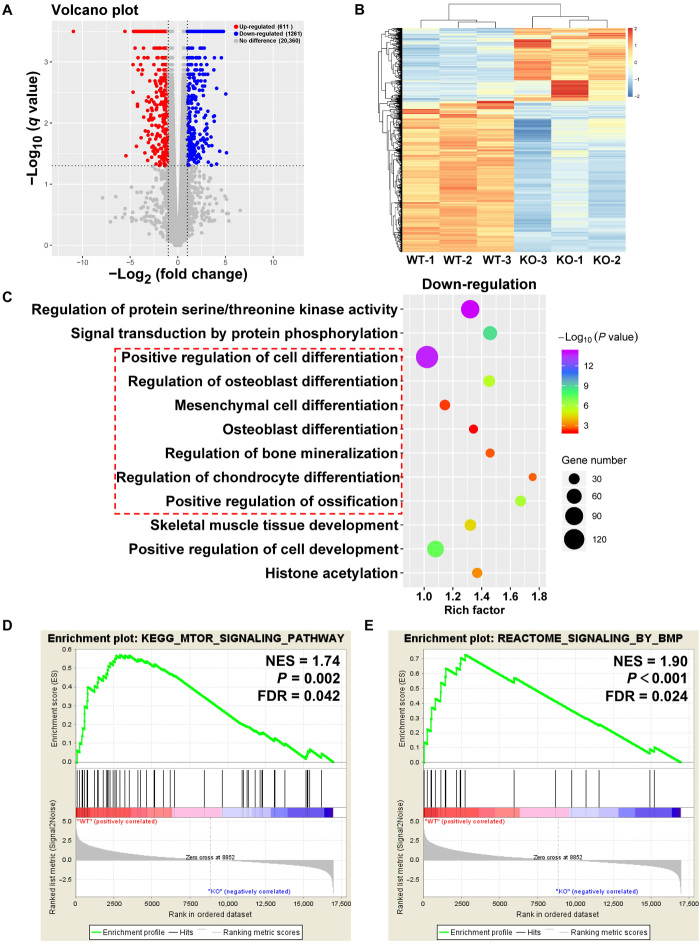
Fig. 2. RNA-seq analysis of tendon between WT and mTOR-knockout (mTOR-TKO) mice.
(A) Volcano plot of gene expression (mTOR-TKO versus WT; fold change, ≥2; q value < 0.05). (B) Heat map of differentiated expression genes. (C) GO analysis of differentially expressed genes. (D and E) GSEA of the genes associated with mTOR signaling and BMP signaling. NES, normalized enrichment score; FDR, false discovery rate; KO, knockout.

