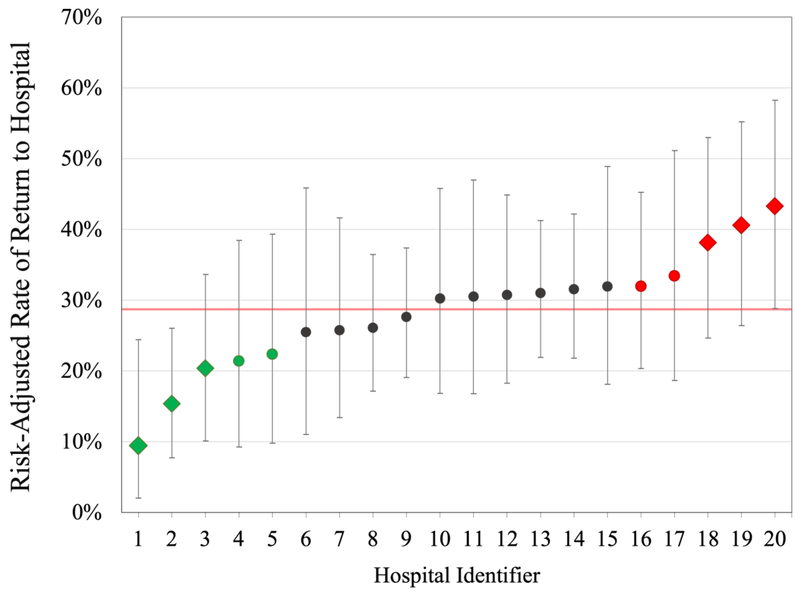
Figure 2:
Variation in Hospital RTH Rates. Risk-adjusted hospital RTH rates ranged from 9.4% to 43.3%. The red line marks the average hospital RTH rate across the MSQC. Green markers denote hospitals in the best-performing quartile (with diamonds marking the best performers), while red markers denote hospitals in the worst-performing quartile (with diamonds marking the worst performers).

