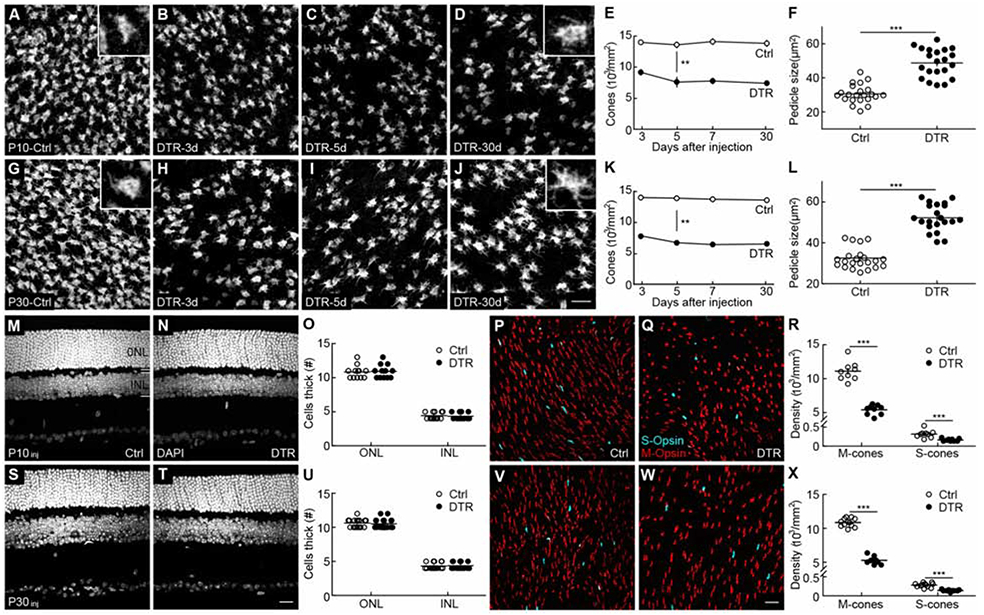
Figure 1. Transgenic model to precisely control cone degeneration.

(A-D) Representative images of cone pedicles with cone arrestin staining in control (A) and 3 (B), 5 (C), and 30 (D) days after DT injection at P10. Scale bar = 20 μm.
(E) Summary data for cone density in control (open circles) and Cone-DTR (filled circles) retina in (A-D). Cone density was lower in the Cone-DTR than in the control group (p = 4.9 x 10⁻²¹ by two-way ANOVA) and stable across time within each group (control, p = 0.84, Cone-DTR, p = 0.14 by one-way ANOVA, n = 3-5 mice and 5-7 images regions per mouse for each time point and genotype).
(F) Summary data for cone pedicle size in control (open circles) and Cone-DTR (filled circles) retinas 30 days after DT injection.
(G-J) Representative images of cone pedicles with cone arrestin staining in control (G) and 3 (H), 5 (I), and 30 (J) days after DT injection at P30. Scale bar = 20 μm.
(K) Summary data for cone density in control (open circles) and Cone-DTR (filled circles) retina in (G-J). Cone density was lower in Cone-DTR than in control retinas (p = 1.1 x 10⁻²⁸ by two-way ANOVA) and stable across time within each group (control, p = 0.74, Cone-DTR, p = 0.27 by one-way ANOVA, n = 3-4 mice and 5-7 images regions per mouse for each time point and genotype).
(L) Summary data for cone pedicle size in control (open circles) and Cone-DTR (filled circles) retina at 30 days after DT injection.
(M, N, S, T) Representative images of vertical slices in control (M, S) and Cone-DTR (N, T) retinas 30 days after DT injection at P10 (M, N) and P30 (S, T) stained with DAPI. Scale bar = 20 μm.
(O, U) Summary data for outer nuclear layer (ONL) and inner nuclear layer (INL) thickness for P10 (O) and P30 (U) DT injections.
(P, Q, V, W) Representative images from dorsal regions of control (P and V) and Cone-DTR (V and W) retinas 30 days after DT injection at P10 (P, Q) and P30 (V, W) stained for M-opsin (red) and S-opsin (cyan). Scale bar = 20 μm.
(R, X) Summary data for M- and S-cone densities in control and Cone-DTR retinas after DT injection at P10 (R) and P30 (X). The ratio of M-/S-cones was unchanged in Cone-DTR compared-control retinas, indicating that cone removal affected both cells equally. Throughout this figure, absence of an asterisk indicates p ≥ 0.05, * indicates p < 0.05, ** indicates p < 0.01, and *** indicates p < 0.001. See also Table S1 and Figure S1.
