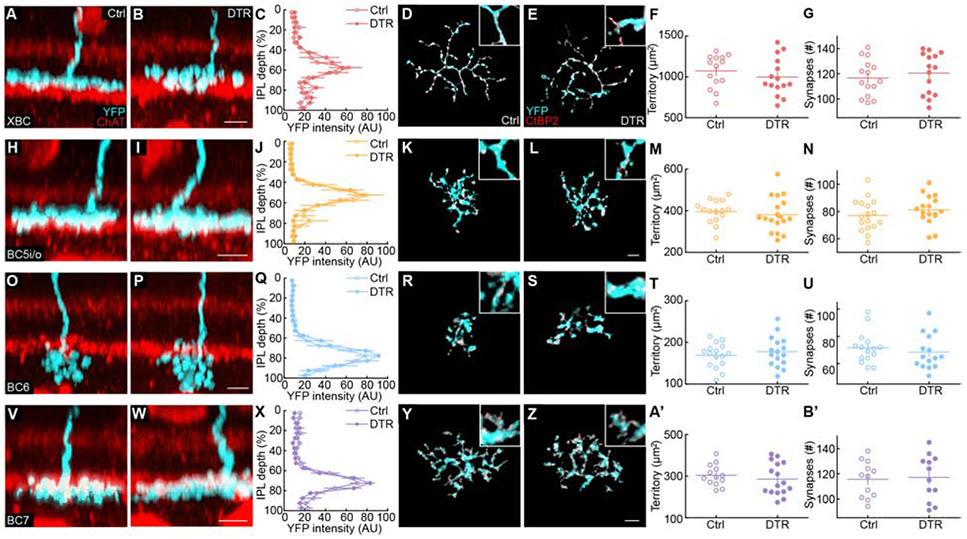
Figure 2. Bipolar cell axons remain stable after cone degeneration.

(A, B, H, I, O, P, V, W) Representative side view images for axons (cyan) of XBC (A, B), BC5i/o (H, I), BC6 (O, P) and BC7 (V, W) cell in control (A, H, O, V) and Cone-DTR (B, I, P, W) retinas 30 days after DT injection at P10 with choline acetylase (ChAT, red) staining for starburst amacrine cells.
(C, J, Q, X) Summary data of axon stratification profiles in control (open) and Cone-DTR (filled) for XBC (C), BC5i/o (J), BC6 (Q), and BC7 (X) cells.
(D, E, K, L, R, S, Y, Z) Representative images of maximum intensity projections for axons (cyan) of XBC (D, E), BC5i/o (K, L), BC6 (R, S), and BC7 (Y, Z) cells in control (D, K, R, Y) and Cone-DTR (E, L, S, Z) retinas 30 days after DT injection at P10. Ribbon release sites were stained for CtBP2 (red) and labeling associated with a single cell masked based on the image of its cytosolic fluorescence (YFP, cyan). Scale bar = 5 μm.
(F, G, M, N, T, U, A’, B’) Summary data for axonal territory (F, M, T, A’) and number of synapses per axon (G, N, U, B’) in control (open) and Cone-DTR (filled) XBCs (F,G), BC5i/o (M, N), BC6 (T, U), and BC7 (A’, B’) cells. Throughout this figure, absence of an asterisk indicates p ≥ 0.05. See also Table S2 and Figure S2.
