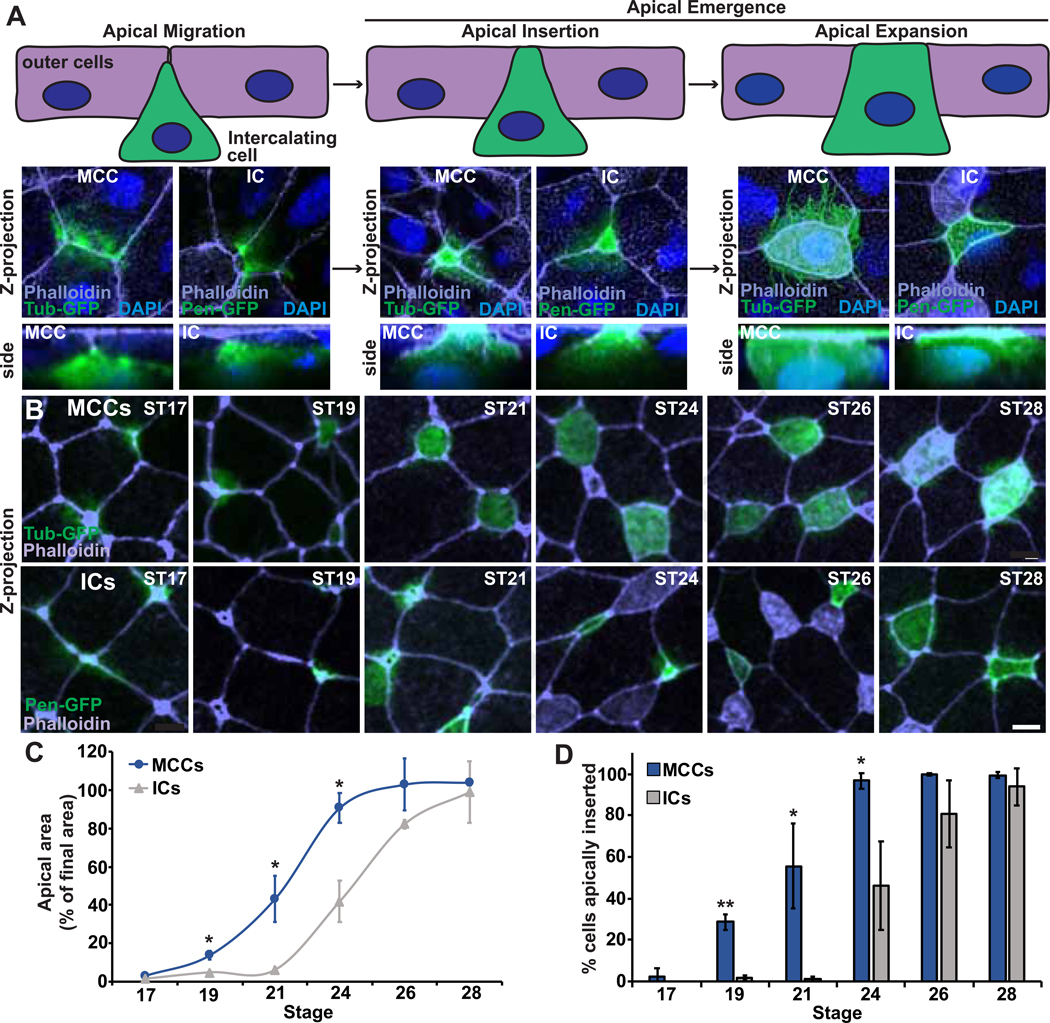
Figure 1. MCCs and ICs undergo intercalation at different developmental stages.
A, (top) Schematic of the progression of intercalation during development and (bottom) representative Z-projections and zoomed in side projections of embryos injected with Tub-GFP (to mark MCCs) or Pen-GFP (to mark ICs) during intercalation. B, Developmental time-course showing Z-projections of Xenopus embryos injected with Tub-GFP or Pen-GFP and stained with phalloidin. Scale bar, 10um. C, Quantification of MCC or IC apical area (as a percentage of final cell area) to measure intercalation progress. 100% indicates complete intercalation and incorporation into the outer epithelium. D, Quantification of the percentage of MCCs or ICs that have apically inserted (defined as an apical area >35μm2, see Figure S1) throughout the radial intercalation process. For graphs, dots (C) and bars (D) represent the mean, error bars indicate SD, and *p<0.05, **p<0.01. The n’s for each experiment are indicated in in Table S1. See also Figure S1 and Table S1.

