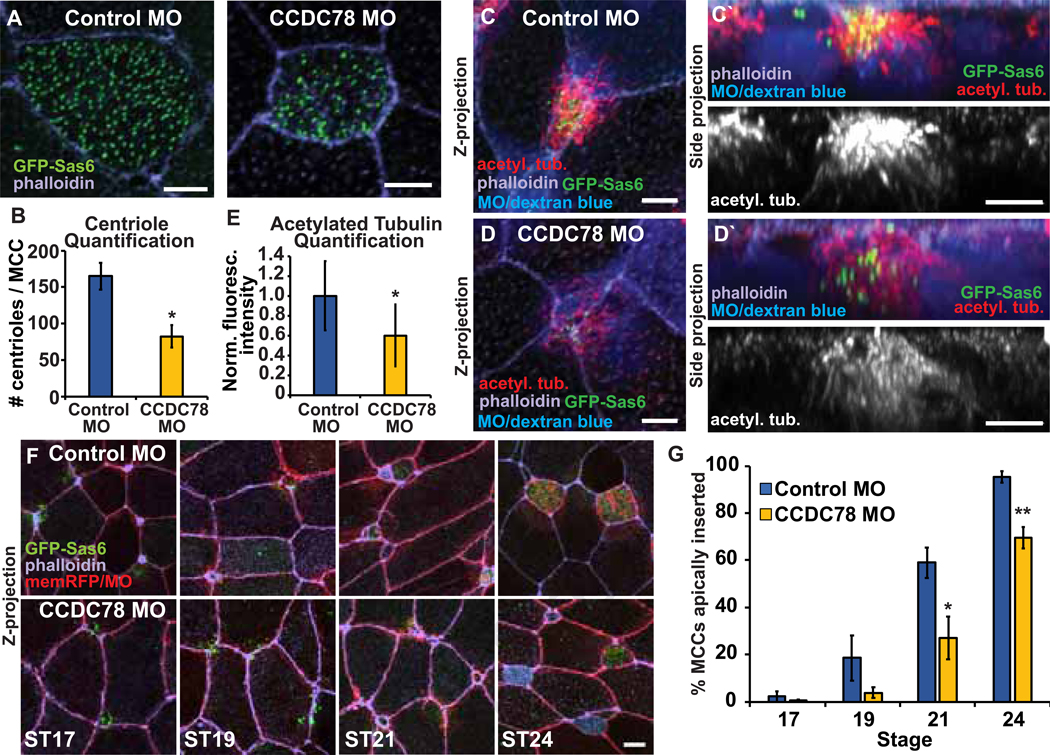
Figure 2. Decreasing MCC centriole number results in decreased MT density and a delay in apical insertion.
A, MCCs injected with Control MO or CCDC78 MO and GFP-Sas6 mRNA stained with phalloidin. B, Quantification of centriole number in Control and CCDC78 MO MCCs. C-D, Z-projections of MCCs injected with Control MO (C) or CCDC78 MO (D) with dextran blue as a tracer and GFP-Sas6 and stained with α-acetyl. tub. and phalloidin with side projections (C’, D’). E, Quantification of acetyl. tub. staining in intercalating Control and CCDC78 MO MCCs. Fluorescence was normalized relative to the mean Control MO fluorescence for each independent experiment. F, Time-course of Z-projections displaying progression of MCC intercalation in Control and CCDC78 MO embryos injected with GFP-Sas6 and membrane (mem)-RFP as a tracer and stained with phalloidin. G, Quantification of the percentage of MCCs apically inserted throughout the radial intercalation process. For all bar graphs, bars represent the mean, error bars indicate SD, and *p<0.05, **p<0.01. Scale bar in A, C, C’, D, D’ is 5μm and in F is 10μm. The n’s for each experiment are indicated in Table S1. See also Figure S2 and Table S1.

