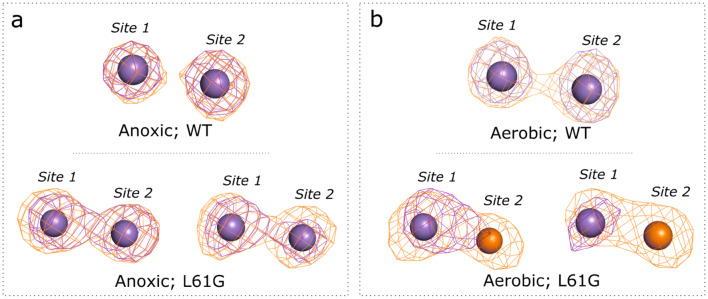
Fig. 3.
Representative anomalous difference density at the Mn (purple) and Fe (orange) edges from WT and L61G variant apoprotein crystals, soaked with MnII and FeII in a anoxic and b aerobic conditions. Difference density maps for the metal sites in WT BaR2b protein and anaerobically reconstituted L61G variant are contoured at 5σ; for the aerobically reconstituted L61G cofactor—at 4σ. At the Fe edge, both Mn and Fe display an anomalous signal. Quantification of metal content in each position is done via peak integration of the respective anomalous difference maps (Q-XAD [37])

