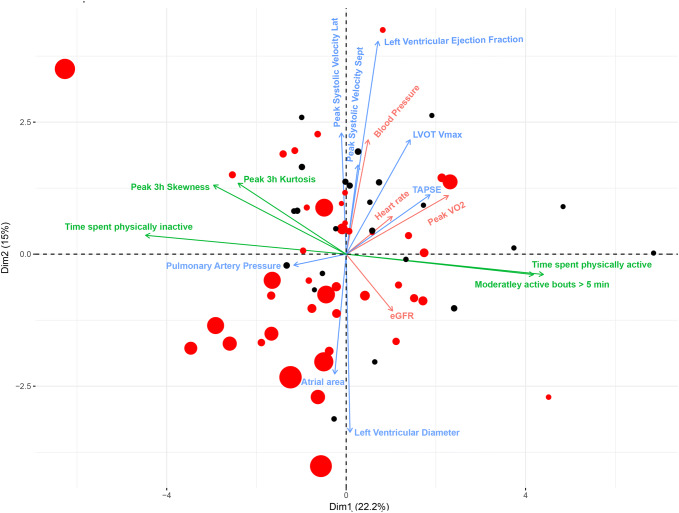
Fig. 3.
PCA and biplot on physiological variables and individual observations, where red dots denote patients suffering an event and the size of the dot is proportional to the event, larger dots denote earlier events. There was a high overall correlation between all variables and 40% of the overall variance could be captured with the first two principal components. Variables related to daily physical activity had highest loading on the 1st component and echocardiographic variables on the second. Exercise capacity and heart rate contributed to both PC1 and PC2. The biplot indicates, as expected, the prognostic utility of the investigated physiological variables: Cox proportional hazard-ratio calculated on high vs low loading on PC1 and PC2 showed an HR of 1.8 and 2.8, respectively. With both components combined the hazard ratio (HR) for patients in lower left quadrant of the PCA was 4.0 (highest risk) compared with patients in upper right quadrant (lowest risk)

