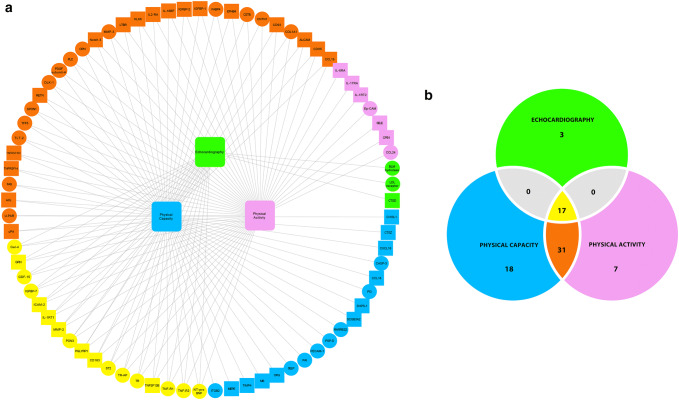
Fig. 4.
Network inference edges a denote significant correlations and the length of each edge is inversely proportional to the strength of the correlation. Thus, nodes appearing closely together share higher number of significant edges, and large nodes indicate key markers with many significant connections. The network analysis identified 17 biomarkers, b relating to the majority of the clinical components and one, GDF15 had significant connections to all components. These key markers contained both classical biomarkers considered to reflect cardiac stretch (ST2 and BNP) but also a large number of inflammatory components and factors related to metabolism such as IGFBP7

