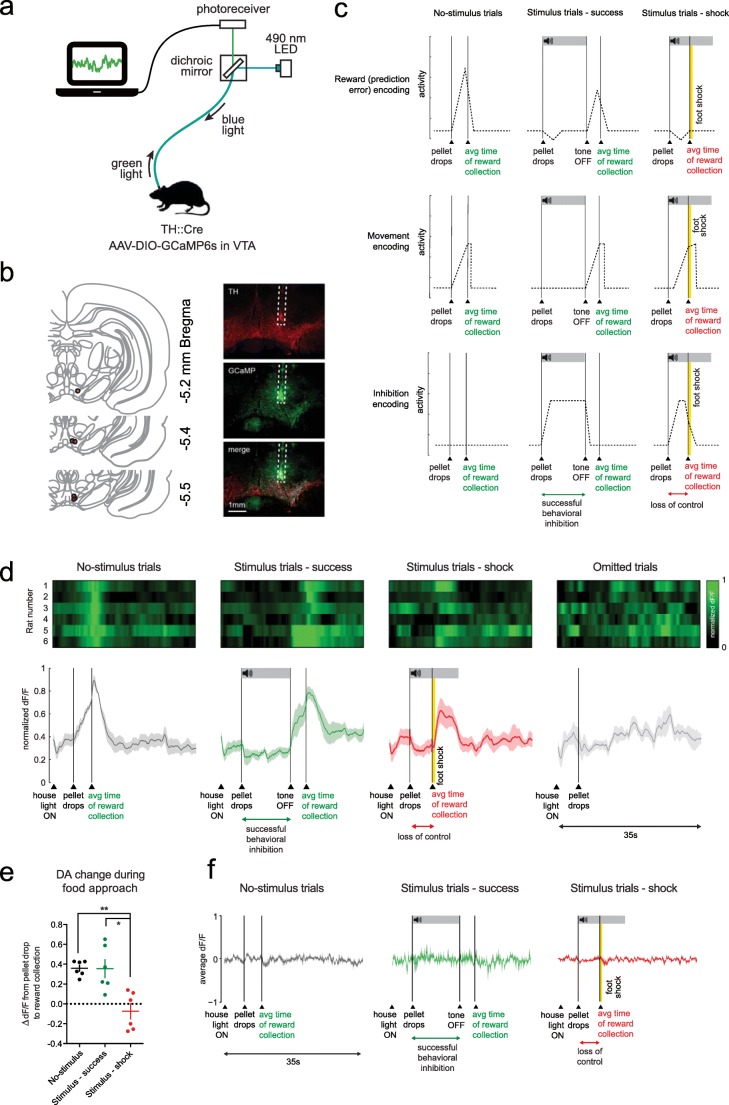
Fig. 2.
Dopamine neuron activity during behavioral inhibition. a Fiber photometry setup. b Histological verification. Red circles indicate fiber placement of individual animals. c Expected activity patterns. d VTA DA neuron normalized activity during the different trial types (n = 6 rats). Bottom graph shows mean ± standard error of the mean of the six animals. e Quantification of dF/F signal during food approach. **P = 0.0098, *P = 0.0105 in post hoc t tests (see Supplementary statistics table in Online Resource 1). f dF/F of animals injected with control fluorophore eYFP (n = 4 rats). Note that these graphs show the unnormalized dF/F (different than panel d)

