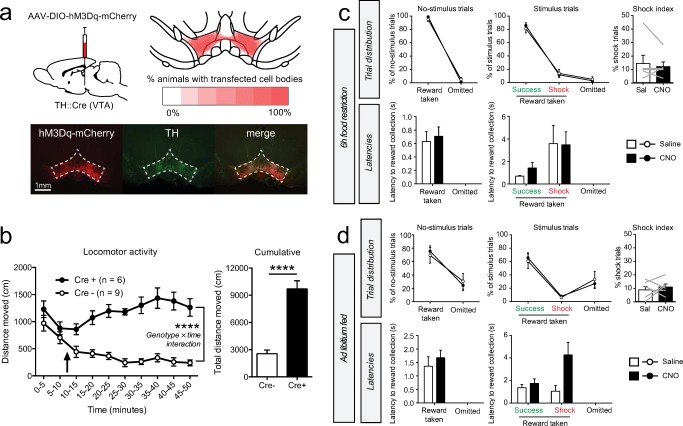
Fig. 3.
Chemogenetic VTA DA neuron activation. a Experimental procedure and histological verification of hM3Dq-mCherry expression. Bottom and top right images represent coronal slices of the VTA. b Locomotor test. Arrow indicates i.p. CNO injection (0.5 mg/kg). ****P < 0.0001 (see Supplementary statistics table in Online Resource 1). c Task performance after i.p. CNO injection in hungry animals (n = 6 rats). The shock index is a measure for the relative amount of shock trials compared for the number of omissions and is computed by 100% × shock trials/(shock + success trials). Gray lines in the shock index graphs indicate individual animals. d Task performance after CNO injection in ad libitum fed animals (n = 6 rats). Gray lines in the shock index graphs indicate individual animals

