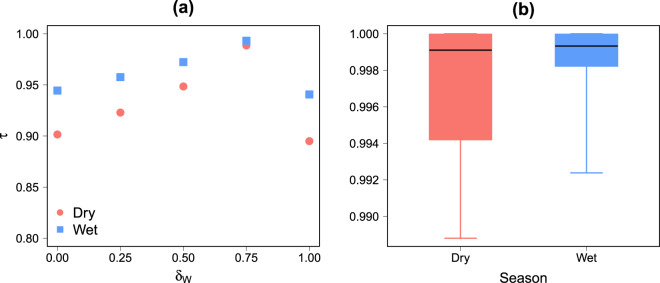
Figure 10.
Parameters (a) and land use weights (b) sensitivity analysis in dry and wet seasons. (a) Kendall’s τ coefficient between the reference ranking and the ranking obtained with different parameter values as a function of δW. For each δw, the τ values have been averaged over δR values. The value of τ for each couple of (δW, δR) are available in Supplementary Information (Tables S1 and S2). (b) Boxplots of the Kendall’s τ coefficient between the reference ranking and the ranking obtained with different land use weight values. Each boxplot is composed of the minimum, the lower hinge, the median, the upper hinge and the maximum. The value of τ for each land use weight values are available in Supplementary Information (Tables S3 and S4).

