
Figure 8.
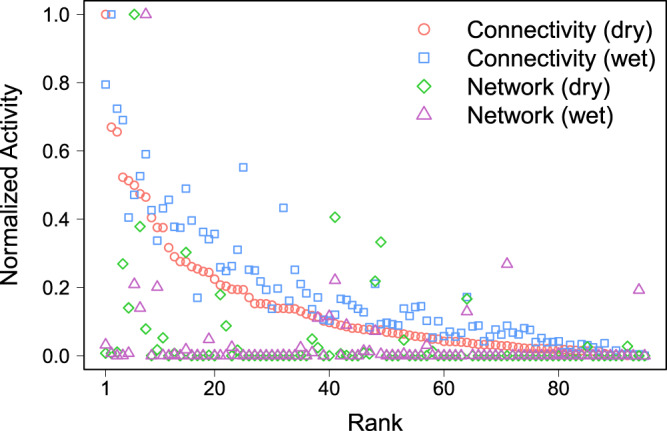
Rank-size distribution of the normalized activity obtained with the landscape connectivity and the network approaches. The total activity (potential livestock movements for the landscape connectivity and total of out- and in-strength for the network approach) contained in each administrative unit have been considered and each distribution have been normalized by its maximum value. The values are ordered according to the activity obtained with the landscape connectivity approach in dry season. Values obtained with the landscape connectivity approach have been calculated with the parameter values δW = 0.8 and δR = 0.1 and the land use weights presented in Table 1.