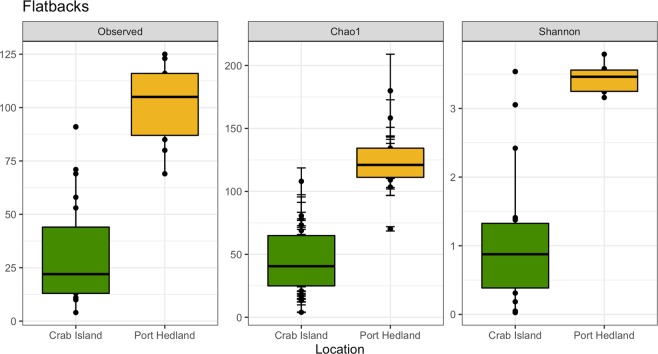
Figure 2.
Alpha diversity estimates for gut microbial communities for flatback turtles from Crab Island, Queensland and Port Hedland, Western Australia. Individual points and brackets represent the richness estimate and the theoretical standard error range associated with that estimate, respectively. Within each panel, the samples are organized into location of capture, and a boxplot is overlaid on top of this for the two groups. Significant differences existed for all alpha diversity metrics, Observed OTUs (χ2 = 17.26, df = 1, p < 0.01), Shannon diversity (χ2 = 16.30, df = 1, p < 0.01), and Chao1 estimates (t = −7.05, df = 16.97, p < 0.01).

