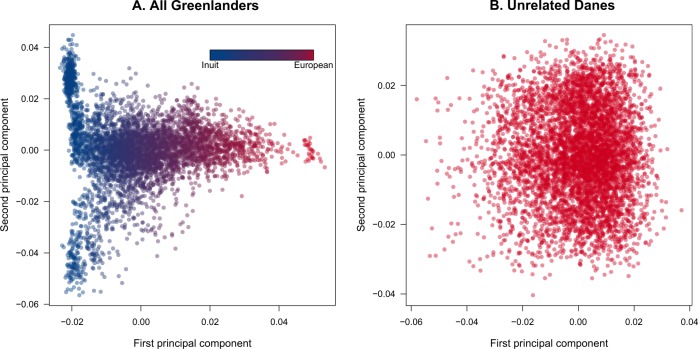
Fig. 1. Population structure of the Greenlandic and Danish cohorts.
a Principal component analysis of the entire Greenlandic sample (N = 4659). Individuals were colored according to their admixture proportions as estimated with ADMIXTURE assuming K = 2 ancestral components. Note that Greenlanders with a high proportion of Inuit ancestry (blue points) present further population structure along the second principal component. b Principal component analysis of the unrelated Danish sample (N = 5470). Due to persisting batch effects, the Danish data were pruned with PLINK (window size = 50; step size = 5; r2 = 0.1) before the analysis.

