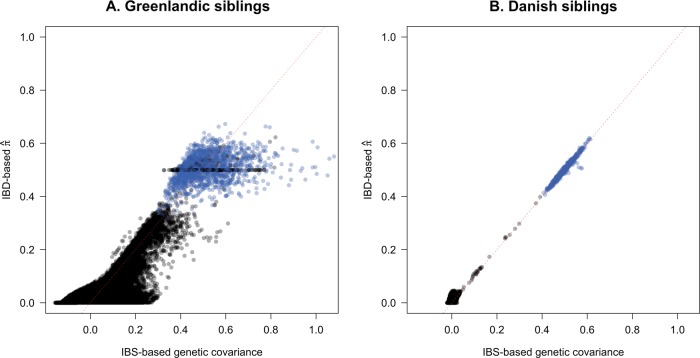
Fig. 2. Identity by state and identity by descent in the Greenlandic and Danish sib pairs.
a Scatterplot of within-pair (blue) and between-pair (black) IBS-based genetic covariance against IBD-based = 2φ estimates for the Greenlandic (MetaboChip) siblings. IBS was computed with GCTA and IBD was computed with RelateAdmix. b Scatterplot of within-pair (blue) and between-pair (black) IBS-based genetic covariance against IBD-based = 2φ estimates for the Danish (OmniExpress) siblings. IBS was computed with GCTA and IBD was computed with PLINK. A negative IBS value denotes that two individuals are related to each other less than average. An y = x dotted line is shown in red.

