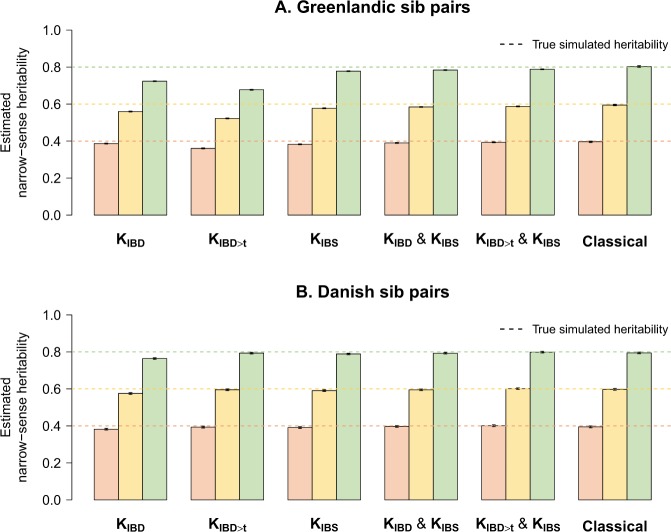
Fig. 3. Heritability estimates of simulated phenotypes without ancestry-specific environmental interactions.
a Mean total heritability estimates and 95% confidence intervals from 1 000 simulated phenotypes with true simulated heritability of 0.4 (peach), 0.6 (yellow) and 0.8 (green) in Greenlandic sib pairs. b Mean total heritability estimates and 95% confidence intervals in Danish sib pairs. Genotype scaling parameter ɑ was set to −1 (GCTA’s standard) for both phenotype simulation and heritability estimation. KIBD: IBD-based GRM; KIBD>t: IBD-based GRM in which all entries below t = 0.05 were set to zero; KIBS: IBS-based GRM.

