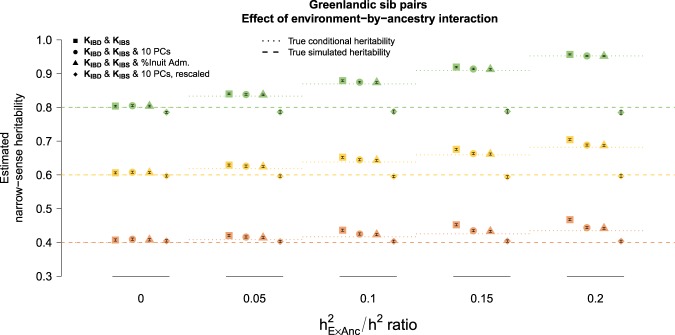
Fig. 4. Mean total heritability estimates for true simulated heritability of 0.4 (peach), 0.6 (yellow), and 0.8 (green) from 1000 simulated phenotypes and 95% confidence intervals of the sampling distribution in Greenlandic sib pairs under the KIBD & KIBS model, without (squares) and with (circles and triangles) population structure covariates, as well as after the additional PCA-based adjustment (diamonds).
The relationship between the environment-by-ancestry (E × Anc) interaction and the true simulated heritability is quantified by the /h2 ratio on the x axis. The models with the covariates (circles and triangles) correspond to estimates of conditional total heritability after adjusting for the E × Anc effect (dotted line). Further rescaling of the conditional heritability estimates by 1 − returns the marginal simulated heritability (dashed line). : proportion of variance captured by the E × Anc interaction; Inuit adm. :proportion of Inuit admixture. Adjustment for 5 or 20 first PCs returned virtually identical results (data not shown).

