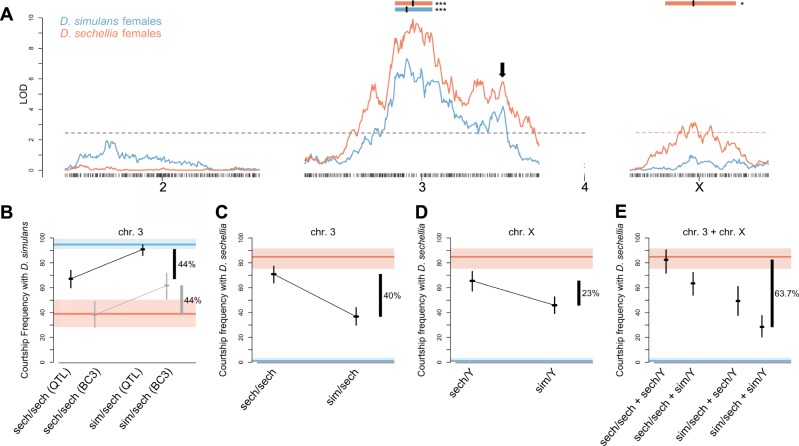
Fig. 2. Single QTL scans for courtship frequency.
a Significant loci for CF toward D. simulans (blue) and D. sechellia females (orange). Significant loci have LOD scores above the dashed lines, which represent alpha = 0.05. Peaks (vertical black lines) and confidence intervals (colored rectangles) are shown above QTL. Asterisks denote significance (*p < 0.05 and ***p < 0.001). The black arrow depicts a secondary peak in LOD score that leads us to hypothesize about the presence of additional QTL on chr3. b The effect of chr3 QTL on CF toward D. simulans females. Black data represents individuals from the mapping population and gray data represents individuals from the separate advanced backcross (N = 186, N = 34, N = 196, and N = 55, from left to right). c The effect of the chr3 QTL on CF toward D. sechellia females (N = 151 for sech/Y and N = 231 for sim/Y). d The effect of chrX QTL on CF toward D. sechellia females (N = 151 for sech/Y and N = 231 for sim/Y). e The combined effect of chr3 and chrX on courtship frequency towards D. sechellia females (N = 74, N = 115, N = 77, and N = 116, from left to right). For all, orange lines represent the phenotype of the D. sechellia parent strain and blue lines represent the phenotype of the D. simulans parent strain. Rectangles of respective colors and whiskers represent the 95% confidence intervals from a binomial test. Effect sizes are estimated on the right.

