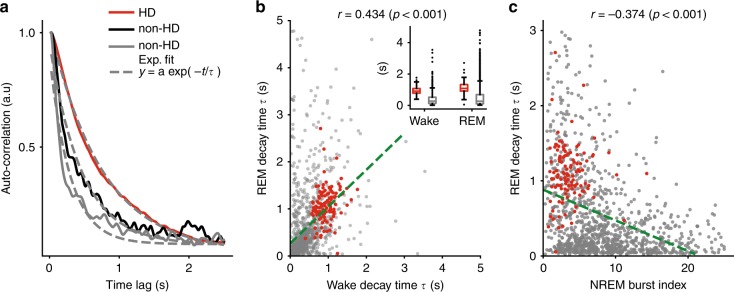
Fig. 6. Intrinsic slow dynamics during wakefulness and REM sleep in the AT and its relation to fast dynamics during NREM sleep.
a Auto-correlograms of three neurons (HD and non-HD neurons) over long timescale (2.5 s) during wake. Dashed gray lines display exponential fit. b Decay time τ between wake and REM sleep. Red dots indicate HD neurons. Inset shows average (±s.e.m.) decay time for HD and non-HD neurons during wakefulness and REM sleep. c Decay time τ during REM sleep as a function of burst index during NREM sleep (r = −0.374, p < 0.001, Pearson’s correlation). HD cells and non-HD cells are indicated by red and dark dots, respectively.

