
Figure 1.
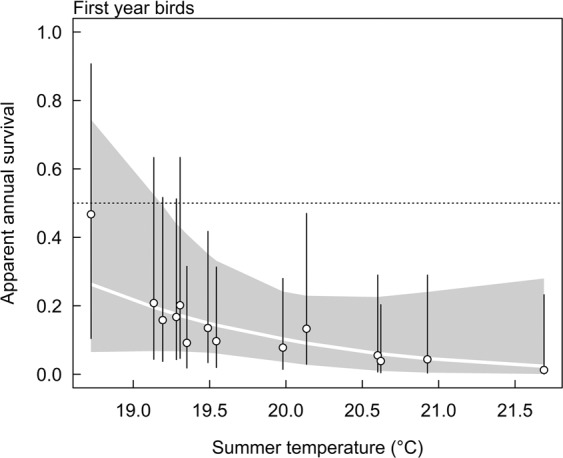
Annual apparent survival estimates for first year birds in relation to summer temperature. Circles are medians of posterior distributions obtained by model 2b, vertical bars connect the 2.5% and 97.5% quantiles of the posterior distributions (95% compatibility intervals). The regression line is based on model 3b. Grey shaded area is the 95% compatibility interval of the regression line. For juveniles, we cannot distinguish between first year after first capture and later years, because later they are adults. Horizontal dotted line is the mean of the prior distribution.