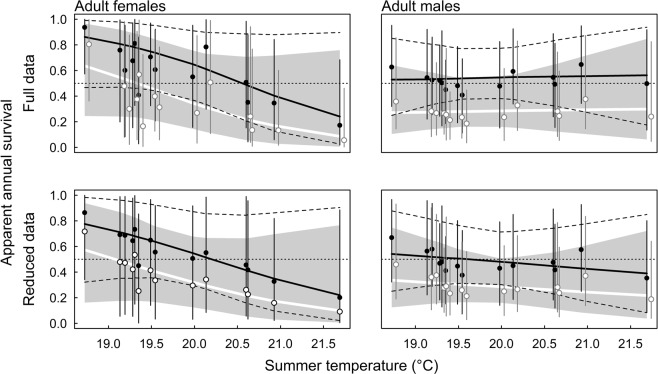
Figure 2.
Annual apparent survival estimates for adult females and males against mean summer (months June to September) temperature based on the full data set (upper panels, all data and accounting for individuals with unknown sex within the model) and the reduced data set (lower panels, only including data of individuals with known sex and only including capture and recapture occasions after their sex has been identified). Open circles and white regression line are apparent survival estimates in the year after first capture, filled circles and solid regression line relate to later years. Shaded area and broken lines indicate 95% compatibility intervals of the regression lines, vertical bars of the annual apparent survival estimates. Dotted horizontal line corresponds to the mean of the prior.

