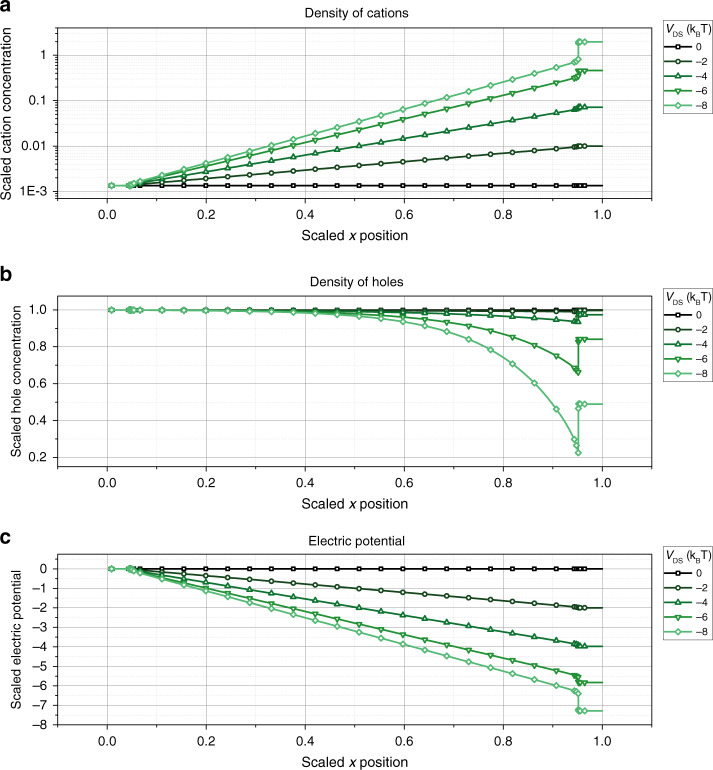
Fig. 7. Equilibrium state of the transistor channel.
a Density of cations pion(x, y = 0), b holes p(x, y = 0), and c electric potential Φ(x, y = 0) along the channel of the simulated OECT shown in Fig. 6 at VGS = −2VT. The parameters used for the simulation are summarized in Supplementary Table 1. Concentrations are scaled to the doping concentration in the PEDOT:PSS layer p0 = 1020 cm−3, spatial coordinates are scaled by the channel length of the device L0 = 1.13 μm, and the potential is scaled by the thermal voltage VT = kBT/e.

