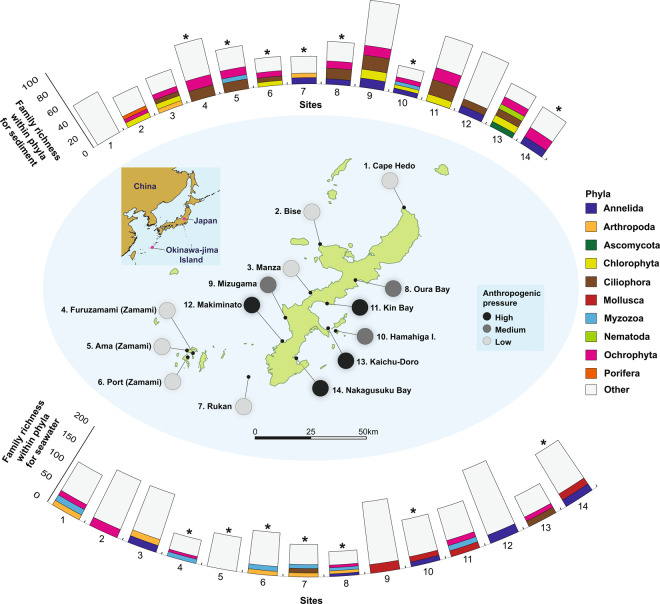
Figure 1.
Sediment and seawater samples collected at 14 sites off the coast of Okinawa, Japan. Circles on the map are shaded according to the level of anthropogenic pressure that they experience (low pressure = light grey, medium pressure = intermediate grey, high pressure = dark grey). Bar graphs indicate the number of taxonomic families assigned at each site based on 18 S rRNA sequences; phyla where the number of families are greater than 10% of the total families for that site are coloured as indicated in the legend. An asterisk above bar graphs indicate sites that were sampled in one year only; sites without an asterisk were sampled twice, over two consecutive years. The figure was created with a combination of QGIS v 3.6 (https://www.qgis.org/en/site/) and Adobe Illustrator v CS6.

