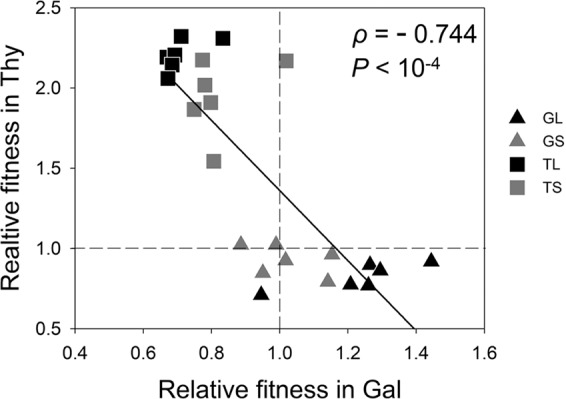
Fig. 2. Correlation between relative fitness values in galactose and thymidine minimal media after evolution in these environments at two different population sizes.

The black line represents the best linear fit (R² = 0.63); the dotted lines represent ancestral levels of fitness.
