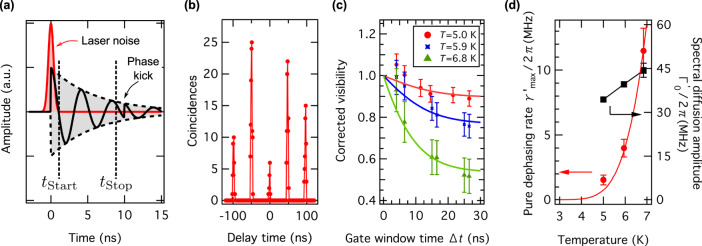
Fig. 4. Pure dephasing of single photon state.
a Visualisation of the time-resolved HOM experiment (not to scale for better visualisation). The black solid line symbolises the single-photon wavefunction, while the black dashed line represents its envelope. For short times close to 0 ns, laser noise photons are observed (red pulse). This contribution is conveniently filtered out by only accepting detection events posterior to the start gate delay tStart. In our visualisation, the photon wave function experiences a phase kick at a time delay of about 10 ns, due to phonon scattering in the V1 excited state. By having a variable stop gate time tStop, we effectively control the integration window Δt = tStop − tStart. This allows us to infer the time scale of pure dephasing. b Uncorrected HOM pattern at T = 5.0 K for tStart = 3.5 ns and Δt = 4 ns. Owing to the short time gating, the raw visibility increases to V0 = 0.85 ± 0.04, which matches the theoretical expectation (0.80 ± 0.01) considering only experimental imperfections (see Supplementary Note 3). Dots are data and lines are visual guides. c Corrected HOM visibility at tStart = 3.5 ns and varying Δt and at three different temperatures. For Δt → 0 ns, visibilities approach unity, as pure dephasing is completely suppressed. Dots are data (red circles: 5.0 K, blue cross marks: 5.9 K, and green triangles: 6.8 K), and lines with associated colours are fits for data at each temperature according to Eq. (1). d Temperature-dependent pure dephasing rate (red circles) and associated spectral diffusion amplitude (black squares). The red line is the fit considering the model described with Eq. (2). The black line is a guide to the eye. Error bars in c and d correspond to one standard error.

