Figure 3.
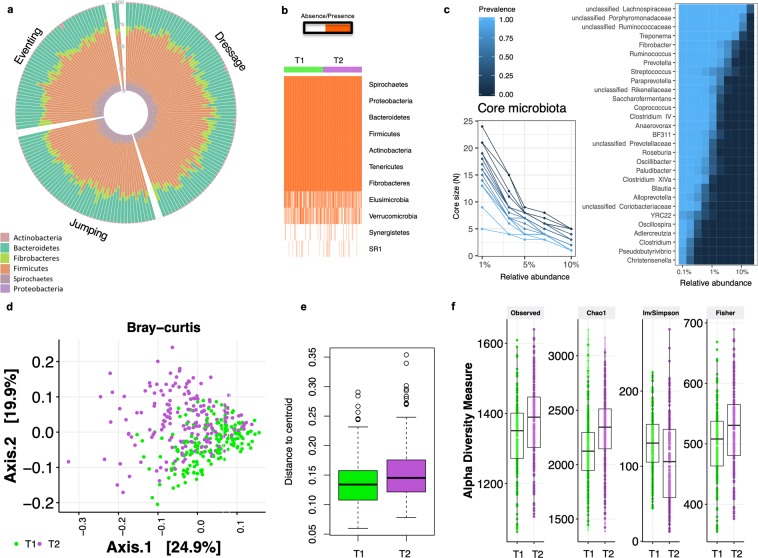
Inter-individual and intra-individual gut microbiota variations. (a) Circular stacked bar plot of the main phyla for each individual in the cohort. Rare phyla such as Elusimicrobia, Verrucomicrobia and Synergistetes are not represented (mean relative abundance across T1 and T2 < 0.01%). Individuals are grouped by discipline; (b) Matrix showing the presence or absence of the phyla detected in our cohort. Each entry in the matrix indicates the presence or absence of each phylum in each individual. Individuals are grouped by time point; (c) The difference in number of genera and their prevalence at different relative abundance thresholds, and the heatmap depicting the core microbiota and their prevalence at different detection thresholds. The heatmap displays the genera shared by 99% of individuals in the cohort with a minimum detection threshold of 0.001%; (d) Dissimilarities in fecal microbiota composition represented by the non‐metric multidimensional scaling (NMDS) ordination plot, with Bray–Curtis dissimilarity index calculated on un-scaled OTU abundances. Samples are colored by time point: T1 (green), and T2 (purple); (e) Variation among the two time points as indicated by dispersion, that is, the distance of individuals from the centroid of their time point. Boxes show median and interquartile range, and whiskers indicate 5th to 95th percentile; (f) Box plot representation of the α‐diversity indexes using the rarefied OTU table for each time point. The box plots feature the median (center line) and interquartile range, and whiskers indicate 5th to 95th percentile.

