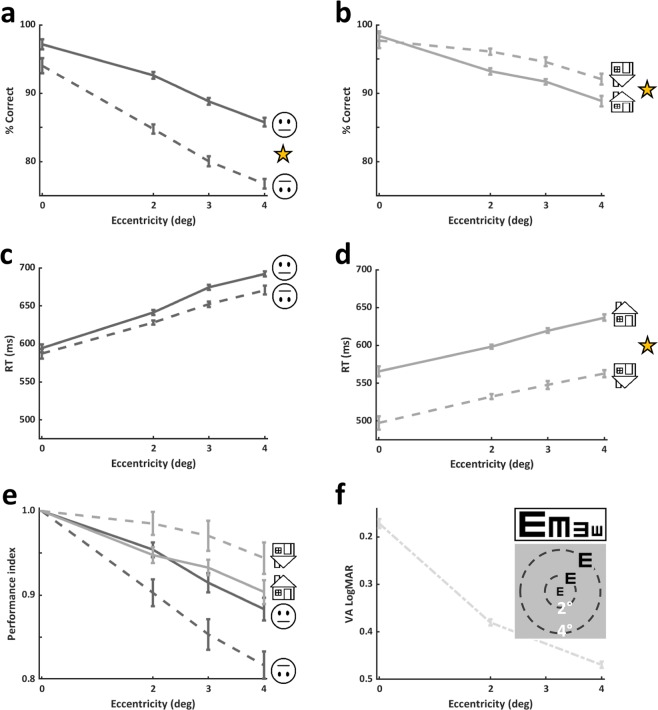
Figure 2.
Experimental results. Upright and inverted accuracy for faces (a) and for houses (b). As can be seen performance declines with eccentricity for faces and for houses (see Results). There was a significant face inversion effect across parafoveal eccentricities (main effect of inversion in a 2-way ANOVA on accuracies with eccentricity and orientation: F(1,196) = 72.2, p < 0.0001) evident in reduced performance for inverted faces relative to upright ones. A significant house inversion effect in the opposite direction to the face inversion effect was found (main effect of inversion in a 2-way ANOVA on accuracies with eccentricity and orientation: F(1,140) = 7.8, p = 0.005; see Results for more details). RTs (median) as a function of eccentricity for upright and inverted faces (c) and for upright and inverted houses (d). Note that RTs of inverted faces were comparable to those of upright faces, while RTs of inverted houses were significantly faster than those of upright houses (main effect of inversion in a 2-way ANOVA on RTs with eccentricity and orientation F(1,140) = 27.87, p < 0.0001). (e) Performance index (relative to performance at the centre of the visual field) calculated for each discrimination experiment) to estimate the rate of decline in performance relative to best vision at the centre. (f) ‘VA’ tumbling E experimental results by eccentricity. As can be seen at 2° visual acuity seems to decline relative to the centre by an average of 0.2 LogMAR units which corresponds to 2 lines on the ETDRS chart, and an additional decline of another line on the ETDRS chart for 4°. Asterisks in (a,b,d) denote significant within-category inversion effects. Data presented in this figure: upright faces (n = 29), inverted faces (n = 22), upright houses (n = 22), inverted houses (n = 15), and ‘VA’ tumbling E (n = 19) . Error bars in (a), (b), (c), (d), and (f) represent SE calculated using the Cousineau method, error bars in (e) represent standard error of the mean (SEM). See also Supplementary Figure SF3.

